Assessing Graph Evaluation in a Citizen Science Context

Need

A common task in computational biology is the creation of protein graphs to convey an idea.  These ideas can range from showing molecular complexities of diseases [1] or general layout of cellular components [2].  However, this is sometimes a complex task that can take a significant amount of time for an expert to complete.  In previous work, the Crowd Intelligence Lab at VT has shown that crowdworkers on Amazon Mechanical Turk can create and evaluate this kind of graph.  However, the field of citizen science (like the projects on Zooniverse [3]) has the potential to also be a good source of evaluation, which can allow a refinement feedback loop to create better graphs.


Approach

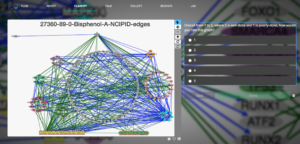
As previously mentioned, Zooniverse is a website that collects, hosts, and promotes citizen science projects.  In addition, they have a good project wizard that helps budding project managers to easily get projects up and running.  Therefore, I have taken a collection of 78 layouts in .jpg format and uploaded them to Zooniverse.  Then, citizen scientists will execute a workflow that evaluates the graph along several metrics and prompts for qualitative feedback.  A picture of the interface can be seen below.

Benefit

This project aims to benefit biologists and related experts through giving them a tool to enhance and evaluate generated graphs.  This tool should quickly give feedback on issues of aesthetics and readability, which will strengthen any argument they are trying to make with the graph.  Furthermore, citizen scientists are performing analysis on these projects for intrinsic benefits rather than extrinsic benefits (like getting paid).  Previous work has shown that difficult tasks are performed more precisely by citizen scientists than crowdworkers [4], which would should benefit this task.

Competition

Competition comes from many places for crowdworkers in this field.  Currently, there are 69 projects hosted on Zooniverse alone; each citizen science project vies for workers to analyze their data.  Furthermore, this competes with the traditional methods of the expert just laying out the graph themselves and refining as needed.  Some data is proprietary or has other needs to be kept private, so not all biologists will think this is an effective tool.  Lastly, the CrowdLayout tool that was developed previously also competes; getting a crowdworkers to layout graphs in minutes is fairly effective.


Results

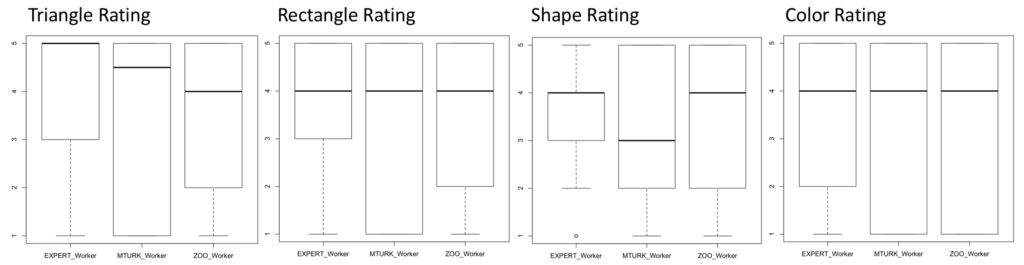
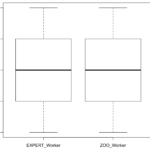
Due to Zooniverse’s requirements on projects they promote, this experiment was unable to get to their main page.  However, 161 responses were gathered after promotion via emails and flyers.  Of these responses, 24 were discarded due to being incomplete answers.  Quantitatively, the results are statistically similar after performing Mann-Whitney U-tests on each metric and the overall rating.  Seen below are the boxplots of the data, showing that the averages and confidence.  Qualitatively, I found that 62 of 119 responses (18 did not provide qualitative feedback) were constructive.  This was described as containing some sort of placement or edge suggestions.  Furthermore, there was evidence of problems with the interface (7 responses), malicious users (11 responses), users who didn’t understand the task (8 users), and issues specifically with edge crossings (12 responses).

Overall

Discussion

Zooniverse’s interface and wizard can create a tool that allows for graph evaluation at a similar effectiveness as paid crowdworkers.  Furthermore, the workers created action items in the form of constructive feedback in 52% of ratings.  It was also odd to see malicious responses (as defined by Gadiraju et al. [5]), since these are volunteer-based studies.  In addition, the hurdles that Zooniverse has for promotion on their website makes it difficult to serve as a permanent solution unless the throughput and graph generation increases.


Citations

  1. Baraba ́si, A.-L., Gulbahce, N., and Loscalzo, J. Network medicine: a network-based approach to human disease. Nature Reviews Genetics 12, 1 (2011), 56–68.
  2. Barsky, A., Gardy, J. L., Hancock, R. E., and Munzner, T. Cerebral: a cytoscape plugin for layout of and interaction with biological networks using subcellular localization annotation. Bioinformatics 23, 8 (2007), 1040–1042.
  3. https://www.zooniverse.org/
  4. Mao, A., Kamar, E., Chen, Y., Horvitz, E., Schwamb, M. E., Lintott, C. J., and Smith, A. M. Volunteering versus work for pay: Incentives and tradeoffs in crowdsourcing. In First AAAI conference on human computation and crowdsourcing (2013).
  5. Gadiraju, U., Kawase, R., Dietze, S., and Demartini, G. Understanding malicious behavior in crowdsourcing platforms: The case of online surveys. In Proceedings of the 33rd Annual ACM Conference on Human Factors in Computing Systems, ACM (2015), 1631–1640.

Read More

NextDoor – Facebook lite?

Tech Demo for NextDoor social media platform

Website: www.nextdoor.com

Demo Leader: Lee

Summary:

Nextdoor’s mission is to be the social media platform for your local community, whether that’s a neighborhood, town, or city.  Their tagline is “the private social network for your neighborhood,” and you might confuse it at first as a green-skinned Facebook clone.  Within its pages, you can find similar tabs as Facebook such as “free and for sale,” “events,” and “Groups.”  However, it also has more specific tabs, such as “crime & safety” and directories pages for your locale.

The Nextdoor company lists several reasons why a user might choose to use their app which includes suggestions like “organize a neighborhood watch group” or “find out who does the best paint job in town” and “finally call that nice man down the street by his first name.”  They even describe their mission as to “provide a trusted platform where neighbors work together to build stronger, safe, happier communities.”

Fortunately, users cannot just view any neighborhood’s postings.  They use a verification process where a user must choose 1 of several different ways to prove they live in that area.  Furthermore, the company states that they do not share information about the user-base with any third parties.  However, they do provide advertising functionality as well as some basic statistics on their user-base on the website (60% female, 72% homeowners, 100k average income).

Reflection:

Nextdoor is an interesting idea that faces immense challenges.

Adoption is the biggest hurdle for this company, as it wants to be a social network for neighborhoods.  They try to solve this by aggressively pushing recruitment in their software.  One side-pane always shows the % of your neighborhood that is signed up and there is a leaderboard for how many people you’ve convinced to join their site.  While they absolutely need to have it, adoption is also negatively impacted by their verification processes.  This is performed by a phone call (registered at the address), credit or debit card registration, Social Security number, or postcard.  These forms of verification can damper adoption since they are sensitive (former 3) or slow (latter).

Once registered and on the site, retention is another hurdle.  Blacksburg, for example, is not terribly active on the service.  For my neighborhood (North main) there are 2 posts in the last week.  This is not an app you need to check on every day if you are in a town setting.  However, there are certainly use cases for this app that don’t need to be constantly monitored.  One of the most active tabs is the “lost and found” tab, which contains a lot of missing pet posts.  Related to this is the pet directory, where you can see the pets and their home addresses.  This combination allows for an easy way of finding out who a lost dog or cat belongs to.  Furthermore, there is a tab for regular directory information for your neighborhood, so you can see who lives in what house.

The competition for this site seems stiff; it seems like most of the functionality it provides can either already be reproduced by Facebook or other social networks through minor tweaks.  Facebook already has a “Free and For Sale” tab, local event information, and local business information.  Crime information can also be searched locally on other websites.  Most other social networking sites reach broader audiences, which would make them more attractive for advertising purposes.  A corollary of this idea is that this is just another website to keep a presence on, which might not be worth the additional work.

Overall, Nextdoor is a good idea that may suffer from challenges it faces.

Read More

Social Media Analytics Tool Vox Civitas

Paper:

Diakopoulos, N., Naaman, M., & Kivran-Swaine, F. (2010). Diamonds in the rough: Social media visual analytics for journalistic inquiry (Links to an external site.)Links to an external site.. In 2010 IEEE Symposium on Visual Analytics Science and Technology (pp. 115–122).

Discussion Leader: Lee Lisle

Summary:

Journalists are increasingly using social media as a way to gauge response to various events.  In this paper, Diakopoulos et al. create a social media analytics tool for journalists to quickly go through large amounts of social media output that reference a given event.

In their tool, Vox Civitas, a journalist can input social media data for the program to process.  First, each tweet is processed along 4 different metrics: relevance, uniqueness, sentiment, and keyword extraction.  Relevance weeds out the tweets that are too delayed in the reaction to the event.  If a tweet reacts to a part of the event that is fairly old, it is weeded out as it is not an initial reaction to that part.  This tool is trying to assess the messages of the tweets as the event happens.  Uniqueness weeds out the messages that are not unique; this mostly accounts for responses that aren’t actually stating any additional reaction.  This metric also weeds out tweets that are too unique; these tweets are considered not about the actual event.  The third metric, sentiment, is measured via sentiment analysis.  Every tweet is processed as positive or negative to what is happening in the event.  Lastly, keyword extraction pulls out popular words in the tweets that have relevance to the event.  This is measured via their tf-idf score.

After explaining how their program processes the social media posts, the authors then performed an exploratory user study on their program.  They found 18 participants with varying levels of experience in journalism: 7 professional journalists, 5 student journalists, 1 citizen journalist, 2 with journalism experience, and 3 untrained participants.  Each of these people used the tool online remotely and answered an open-ended questionnaire.

The questionnaire had the participants run through example uses of Vox Civitas.  Through the questions, the authors identified 2 primary use cases for the program: a way to find people to interview and an ideation tool.  In other words, the tool could sort through the social media posts for the users so that they could find insightful or relevant people to interview.  Also, the tool could help the users figure out what to write about.  The questionnaire also identified how the tool would shape the angles the users would take on the social media output.  Vox Civitas would help drive articles on event content or articles on audience responses to the event.  Another minor angle the authors found that the participants would use is to create meta-analyses of audience response, where the participants would identify demographics of the social media post writers.

Lastly, the authors discuss ways their tool would assist with the journalistic creativity process.  They state that their tool should allow journalists to skip over the initial phases of sensemaking in order for them to more quickly jump to ideation and hypothesis generation.  Since the tool already processes and highlights different types of responses and shows that aggregated information via graphs and other visualizations, the journalists do not have to waste time sifting through all the data to understand it.

Reflection:

I found this paper to be a unique and in-depth user study of their program.  Furthermore, I found their program to be a way for journalists to quickly understand the reaction of the crowd to an external event.  This is in contrast to many of the ways we have looked at interacting with the crowd so far as this is looking at what the crowd creates or does when they are not prompted to do anything.

There were, however, a few issues I had with the paper.  First, the authors acknowledge that their sentiment analysis algorithm only has a accuracy of 62.4%.  They do point out that this isn’t good enough for journalists to reliably count on when looking at that data, however I would have liked to have seen them explore ways of figuring out a confidence value for the analysis or some other way of weeding out the data.  As a corollary, this could have informed design of the user interface; the neutral label on the sentiment analysis visualization only meant that there weren’t posts to analyze.  I felt that this would be better suited to the program showing that it couldn’t determine the sentiment of the posts.

Another issue with the paper was that it would introduce scores or rating systems without explaining them.  For example, inn section 4.4 the authors mention a tf-idf score without explaining what that scoring system measures.  If the authors had explained that a little better I think I could have understood their methodology for extracting keywords significantly more.

I appreciated the focus the authors placed on their user interface; breaking down what each part measured or what it conveyed was helpful to understand the workflow.  Furthermore, their statistics in section 6.4.3 that detailed how much each part of the interface was used was a good way to illustrate how useful each part of the tool was to the participants.  It also conveyed that the participants did take advantage of the features the authors supplied and they were able to understand their usage.

Questions:

  1. Do you think this tool could be used in fields other than journalism?  How would you use it?
  2. The authors used a non-lab study to enhance the ecological and external validity of the study, and tracked how the users interacted with the interface.  Do you think any data was lost in this translation?
  3. The professional journalists were noted to have not used the keyword functionality of the interface, and the authors did not follow up with them to find out why.  Do you have any idea why they might have avoided this functionality?
  4. The participants noted that one way of using this tool was to figure out any links between demographics of the audience and their responses.  Have you seen this in more recent media?


Read More

Would You Slack That? Yeah, probably.

Paper:

Susan E. McGregor, Elizabeth Anne Watkins, and Kelly Caine. 2017. Would You Slack That? The Impact of Security and Privacy on Cooperative Newsroom WorkProc. ACM Hum.-Comput. Interact. 1, 2, Article 75 (November 2017), 22 pages.

Discussion Leader: Lee Lisle

Summary:

Journalists and other newsroom professionals often use different communication methods pursuant to the content they are conveying.  The authors in this paper interviewed 12 active journalists in varying types and sizes of news companies to perform a grounded theory study on their communication patterns.  Their analysis identified what kinds of choices are made when journalists need to collaborate or share information.

Through their interviews, the authors found that journalists will use asynchronous communication methods when they need to memorialize or otherwise keep a copy of what they are sharing in their records, while they use synchronous communication methods for brainstorming and sharing ideas.

The authors also leverage and combine 2 existing models to describe a journalist’s workflow.  The first, Lee and Paine’s Model of Coordinated Action (MoCA) uses several dimensions to frame the context and usage patterns in collaborative work, while the second, Barreau and Nardi’s model of Personal Information Management (PIM) identifies a taxonomy for electric information storage.  The authors combine these models to classify situations where journalists need to communicate with people.

In the interviews, each participant is asked how they would handle different collaborative situations.  These would vary from accessing old work to handling private or sensitive information.  After running through these scenarios, the interview would switch over to more specific communication methods to find out how the participants would use those.  The interview script was included in the paper as an appendix.

The analysis and discussion of the interviews details the use cases for communication platforms.  For example, if a user wanted to collaboratively generate a document or idea, they would use a synchronous style of communication.  If that document needed some amount of security, they would avoid email and use some sort of encryption or privacy filter, such as through iMessage or face-to-face/telephone conversations that are harder to record (or difficult due to legalities).

Throughout, the authors used quotes from the interviews as backup for any claims they made.  This provided the paper with concrete and direct evidence and elicited some user needs for future communication software developments.

Reflection:


I found this paper to be well written with a good analysis of the available data.  In fact, I liked how the authors generalize their findings in the beginning and near the end of the paper, noting that these communication methods would only increase in usage in all sectors of business as people in the workforce started working remotely.  Many of the points the journalists made on why they chose the communication method for a particular task would cause me to agree with them when considering my own workflow.

One particular finding that resonated was the use of email to memorialize a conversation or document.  This kind of external memory technique allows the users to keep information somewhere that they can retrieve it quickly and destroy it when they need to.

It was interesting that the authors, ever cognizant of the security and privacy of their participants, strictly noted that they used encrypted communication methods to perform their interviews, as well as obeyed general IRB protocols.  In a similar vein, the inclusion of their interview script was interesting in that they provided work that is often abstracted into a paper.  I liked being able to read how one of the interviews would flow.  Furthermore, the authors were upfront about the limitations of their analysis, noting that the their target user groups may not have been representative of the entire population.

However, I thought that the answers the journalists gave to some of the questions were too obvious, and that begs the question of whether this analysis was necessary?  Since cataloging these choices and seeing how CSCW can assist with daily life is meaningful and noting which features are most useful in current situations, I believe this paper had just enough purpose.  It does provide a framework for any future work in developing successors to Slack et al.

Questions:

  1. The authors note that “75% of participants indicated that they would not restrict access to [shared] documents within their organization.”  Considering that security and privacy was important to the participants, why do you think they made this choice?
  2. Considering that the authors try to generalize their findings to other fields, do you have similar communication patterns as those interviewed?  If not, what else do you do and why?
  3. The journalists often mentioned that they preferred to be able to have a face-to-face conversation for privacy and security reasons.  Is this actually a viable security method?
  4. Can you think of any other communication software that also fulfills some of the needs laid out by the authors?
  5. Slack is being used for ever-increasing sizes of groups.  For example, the conference HCOMP now has a Slack group for collaboration between crowdsourcing experts.  Do the needs of that kind of user base change the situations?
  6. Bonus Question: The authors included their interview script as an appendix.  Were there any issues with their script?

Read More

Hollaback!

Paper:

Dimond, J. P., Dye, M., Larose, D., & Bruckman, A. S. (2013). Hollaback!: The Role of Storytelling Online in a Social Movement Organization. In Proceedings of the 2013 Conference on Computer Supported Cooperative Work (pp. 477–490). New York, NY, USA: ACM.

Discussion Leader: Lee Lisle

Summary:

Various forms of social media have been able to assist social mobilization movements with events such as the Arab Spring to rating system for Mechanical Turk employers with Turkopticon. In particular, these platforms have allowed for people to find and help other people facing similar struggles or harassments. Hollaback is an organization that brings together victims of street harassment to share their stories and promote awareness. The main platform for their organization is a website, but they have further used mobile technologies to enhance their reach.

After some discussion on various background topics, the authors discussed their semi-structured interviews with 13 users of the platform. Each interview lasted between 30 and 90 minutes and asked users to recount the story they shared on Hollaback, along with their motivations and feelings after they shared their story. The authors then analyzed the interviews using grounded theory to find how people using the platform are affected by the presence and use of the platform. They then continue on to evaluate how sharing stories can help other “genres” of communities.


Reflections:

I found this paper to be a fairly interesting take on how storytelling can assist with the creation of online communities. In particular, I found their sections on previous works to be the best part of the paper, since it was so rich in providing context for the rest of their paper.

I also found it interesting that the authors brought up “slacktivism” in the paper. While they never used the term again, the authors presented details (with quotes!) on how the work of Hollaback (and storytelling communities in general) was not slacktivism despite the relatively low requirements on users. To be more specific (and to not diminish the role of these users), the people in the community don’t need to put in extreme time commitments or go to any joint location in order to “rally” or perform more traditional forms of activism. In addition, the users seemed to be allowed to be as anonymous as they desire to be in their stories, which can lower the requirements and make them feel more at ease.

I also thought the “Researcher Self Disclosure and Reflexivity” section was an interesting addition that I had not considered before this paper.   Understanding one’s own bias and discussing it is something I haven’t seen in many papers. However, I do question if this practice can reduce bias, both from the reader and the author. In this spirit, I will also disclose that I am a fan of storytelling and grounded theory and was before I read (and volunteered to lead discussion on) this paper.

One issue I had with the paper was that over half of the participants were students, while the issue at hand had no specific relation to students. Furthermore, while I recognize that this issue is not a U.S. specific issue, having less than 10% of participants be from other countries seemed like an odd choice for the interviews. The authors did not establish that the culture of the UK is not sufficiently distinct from US culture, and this should have been one of the selection criteria for participants.

Questions:

  • Do you think that this form of storytelling is “slacktivism?”
  • Beyond the two examples in this paper, what are other forms of Frame transformation and extension in social movements?
  • Does the shift from the researcher being a “friendly outsider” to an active participant change the way people should respond to this paper? Furthermore, how does the self-disclosure section impact this?
  • In the discussion I raised issues with 2 different selection criteria for participants. What do you think are appropriate selection criteria for interviewing participants for this kind of study?
  • Last class we discussed the pros and cons of anonymity, and it appears in this paper as well. How would you compare and contrast the ways anonymity helps with this paper and the 4chan paper?

Read More

Digital Vigilantism as Weaponisation of Visibility

Paper:

Trottier, D. (2017). Digital vigilantism as weaponisation of visibility. Philosophy & Technology30(1), 55-72.


Discussion leader: Lee Lisle

Summary:

This paper explores a new era in vigilantism, where “criminals” are shamed and harassed through digital platforms. These offenders may have parked poorly or planted a bomb, but there is no real verification process. They are harassed through the process known as “doxing,” which is where their personal information is shared publically. The authors term this as “weaponised visibility,” and it can lead to other users on the Internet to harass or threaten the accused in person.

The authors define digital vigilantism and compare it to the more traditional vigilantes before the Internet lowered thresholds. In particular, they use Les Johnston’s six elements of vigilantism and define how digital vigilantism embodies each element. These elements and how they are enacted are in Table 1.

With the link to more traditional vigilantism established, the authors then make the argument that the lowered thresholds of the Internet increase the response to the offender’s acts. Once an idea or movement is released on the Internet, the person who started it is no longer in full control. This lack of a singular leader means the response to the offense is uncontrolled, which further means that the digital campaign can vastly exceed boundaries and have a nonproportional response to the offense. As a corollary, the authors point out that the people who start these campaigns would not be aware of how far the response will go. In fact, in the early stages of the Internet, it was considered a separate place from the real world. As time has gone on, the barriers between the digital and real worlds have decreased in scope and context. The authors point out parallels of cyber-bullying and digital vigilantism, but make the distinction that digital vigilantism occurs when citizens are collectively offended by other citizens.

The authors then point out the differences between state actors and these digital vigilantes. They state that a lowered confidence in state actors such as police is responsible for these coordinated efforts online, which then, in turn, results in less cooperation with state actors. Cyber-bullying and revenge porn are used as examples where the vigilantes are taking action since law-enforcement agencies aren’t.

Next, the authors make a comparison of how state actors and these vigilantes perform surveillance. Digital tools have made surveillance significantly easier, and the public has been shown various results of this, such as the Snowden revelations on government actions. Furthermore, the efforts of digital vigilantism can increase surveillance on private citizens when state actors look at the citizens and see that there’s a DV campaign against them. Also, users can over-share their daily lives over social media, such as detailing their exercise routines or other forms of life-logging. The authors make the point that this can even be used against the users in a DV campaign, since the visibility can lead to more doxing. The authors also write about the concept of “sousveillance,” where a less powerful actor or citizen monitors more powerful actors, such as the state. This can be seen in recordings of police responses. Lastly, the authors point out that pop-culture is likely encouraging occurences of DV. Reality-TV shows often encourage the contestants to try to catch each other engaging in “dishonest or immoral behavior.” This form of entertainment normalizes the concept of surveillance and leads to further efforts in digital vigilantism.


Reflections:

This article makes some interesting points about how digital vigilantism is an extension of traditional vigilante efforts. Since the Internet lowers the bar for the creation of what is essentially a mob armed with either facts or pseudo-facts, retaliation happens more easily and is less controlled. However, as this kind of reaction happens more and more frequently, the creators of these mobs should understand their actions more. The statement that DV participants “may not be aware of the actual impact of their actions” seems like less of an excuse as more of these examples come out.

Digital Vigilantism doesn’t always create poor outcomes. In some of their examples, the people targeted by the vigilantes were performing actions that should be illegal. There are now cases where cyber-bullying is a criminal act. Revenge porn is now illegal in 26 states. The digital vigilantism against these actions may have helped create the laws to make them illegal.

Questions:

  • This article, written in 2015, makes the point that white nationalism and the KKK are linked to digital vigilantism. Considering recent events, do you agree that DV has caused (or helped cause) the resurgence of these groups?
  • How do you think reality-TV shows influence the public? Do you agree with the authors statement that it encourages digital vigilantism?
  • In this class, we have gone over several cases where DV’s response has been extremely disproportionate. Are there examples where DV has helped society?
  • The authors point out that law-enforcement can easily see DV campaigns against individuals. Should state actors ignore DV campaigns?  Should they try to contain them?
  • The authors point out the concept of “sousveillance,” where less powerful actors monitor more powerful actors. This can explicitly be seen in the movements to monitor police officers and their interactions with people. What do you think about this kind of DV?

Read More

Galaxy Zoo – A Citizen Science Application

Technology:

Citizen Science Application “Galaxy Zoo”

Demo leader: Lee Lisle

Summary:

Galaxy Zoo is a citizen science application in the Zooiniverse collection of projects. Citizen science is a special category of applications that uses the power of crowds to solve complex science problems that cannot be easily solved by algorithms or computers. There are many different citizen science apps that you can try out on Zooniverse if you want to learn more about this field.

Galaxy Zoo asks its users to classify various pictures of galaxies from pictures from the Sloan Digital Sky Survey, the Cerro Tololo Inter-American Observatory, and the VLT Survey Telescope. Starting in 2007, this project has been so successful that it actually spurred the creation of the entire Zooinverse site. In fact, the Galaxy Zoo team has written 55 different papers from the data they have gathered from the project.

As an example of what they have discovered using crowd-generated data, the team created a new classification of galaxy based on the observation of the citizen scientists. After the workers found a pattern of pea-like entities in many galaxy pictures, the team looked closer at those formations. They found that the formations were essentially young “star factory” galaxies that created new stars much more quickly than older, more established galaxies.

Also, it’s interesting to note that the project started because a professor assigned a grad student to classify 1 million pictures of galaxies. After a grueling 50,000 classifications of these pictures done by one person, the student and professor came up with a solution to leverage the crowd to get this data set organized.

You can also create your own project on Zooniverse to take advantage of their over 1 million “zooite” user base. This is best used for massive datasets that need to be worked on manually. It also uses both intrinsic and extrinsic motivations for users through the benefit of science and giving each user a “score” on how many classifications they have performed.

Demo:

  1. Go to the Zooniverse website.
  2. Register a new account.
  3. Click on “Projects” on the top menu bar to see all of the citizen science apps available. Note that you can also search by category, which is useful if you want to work on a particular field.
  4. To work on specifically Galaxy Zoo, start typing “galaxy zoo” in the name input box on the right side of the screen (under the categories scroll bar).
  5. Click on “Galaxy Zoo” in the auto-complete drop down.
  6. Click on “Begin Classifying.”
  7. Perform classifications! This involves answering the question about the galaxy in the box next to the picture. It may also be helpful at this step to click on “Examples” to get more information about these galaxies.

Read More