4/29/2020 – Sukrit Venkatagiri – DiscoverySpace: Suggesting Actions in Complex Software

Paper: C. Ailie Fraser, Mira Dontcheva, Holger Winnemöller, Sheryl Ehrlich, and Scott Klemmer. 2016. DiscoverySpace: Suggesting Actions in Complex Software. In Proceedings of the 2016 ACM Conference on Designing Interactive Systems (DIS ’16), 1221–1232. https://doi.org/10.1145/2901790.2901849

Summary: In this paper, the authors introduce an extension to Adobe Photoshop, called DiscoverySpace, that provides high-level suggestions based on visual features of an image to help onboard new users. These suggestions/actions are drawn from an online user community. There are several problems users face when using a complex system for the first time, such as unfamiliarity with jargon, ease of use of tutorials, and the fact that many tasks can be accomplished through different routes. User studies showed that DiscoverSpace reduce the overhead in introducing new users to Photoshop, and suggest steps that can be replaced with advanced algorithms to speed up this process in the future.

Reflection: The paper tackles a crucial problem for novice users: providing an easy-to-use on-boarding process that simultaneously teaches them how to use the system without scaring them away with to much information. DiscoverySpace is an initial attempt to address this problem by learning from previous users and shows how we can combine AI and user interface design to build effective on-boarding tools for complex systems.

While this system was used specifically for Photoshop, I wonder how a similar approach can be used for other systems that many administrators and creatives use. For example, tax software, payroll processing software, video editing tools, etc. I also wonder if such approaches using data mining can be universalized, or if it is dependent on the user, context, and tool. Sometimes all a user wants to do is crop an image, and not do something more complex. Other times, users may already be following an online tutorial, after searching for the one they like. Perhaps tools like DiscoverySpace should allow for other users to create their own on-boarding workflows instead of having a fixed one for all users. This is because, as mentioned, creative tools allow for multiple flows that can lead to the same output, and some may make more sense to users than others.

Finally, I really appreciate the discussion section. in this paper, since it presents ideas for designing a more universal toolkit. While we can’t build a dataset of all possible actions for complex tools and creative processes, it would still help.

Questions:
1. Do you think everyone should undergo the same on-boarding process when using creative tools, or be given the choice to go through different pathways?
2. Why are these tools so complex? How can we provide more features without introducing more complexity into the information architecture?
3. What are some drawbacks to this approach?

Read More

Experimental Design for Evaluating Experts’ Reflection on Image Geo-location with GroundTruth

Need:

For a journalist, it is essential to verify news from several sources, with as little time as possible. Especially, verifying images and videos from social media is a frequent task for modern journalists [1]. The process of verification itself is tedious and time-consuming. Often the journalists have very little time to verify breaking news, as they are required to be published as soon as possible. Often times the experts have to manually search throughout the map to find a potential match. GroundTruth [2] is crowdsource based geo-location solution, which allows the users to use crowd workers in order to find the potential location of an image. The system provides a number of features, such as uploading an aerial diagram of the mystery image, drawing an investigation area on the Google Map for searching, dividing the search space into sub-regions on which the crowd workers cross-check the satellite view with the diagram, enabling the expert user to go through the crowd feedback to find a potential match. This novel approach of geo-locating, however, has not been tested with respect to the currently existing tools. My research is to design an experiment that would evaluate the experts’ reflection using GroundTruth.

Approach:

For the research purpose, I considered the scenario where the experts need to verify an image based on a social media post. These images on the social media post are usually associated with a location. My high-level goal was to replicate similar situation for our experiment. For this reason, I needed to set some ground rules for selecting the images for our experiment. I considered both urban and rural images for my experimental design. Based on the level of details for the urban images mentioned in the paper [2], I created a similar level of details for the rural images. These details are important to draw the diagrams of the images. I chose medium-level (3 and 4 level) of detailing for drawing diagram for both urban and rural images since the findings in the paper [2] suggest medium-level details performs best with the crowd workers. I wanted all of the images, both urban and rural images, to be from the same environment. For this purpose, I selected the “Temperate Deciduous Forest” as my preferred biome. The reasons behind choosing this biome are the location being in the Eastern United States, Canada, Europe, China, and Japan, having the moderate population, having four seasons, the vegetation being similar in both urban and rural images, etc. While selecting the images, I used GeoGuessr website, which provides street view images without any labels using Google Map API v3 [3]. I created a set of guideline for selecting these images in order to recreate the images for later purposes. I based the set of guideline on two criteria: 1) the number of unique objects, and 2) the number of other objects. Firstly, I identified the objects based on the details mentioned in the paper [2]. Among all the objects, I specified some as “unique” objects based on their unique features with respect to its surrounding. I ran some initial searching where these unique features contributed significantly more than its counterparts did in geo-locating the images. The guidelines were created to categorize the images into 1) Easy, 2) Medium, and 3) Hard. I chose four final images, two from the rural area and another two from the urban area, of medium level difficulty for my experiment. Finally, I set a guideline for the information on the location that would be provided. For this purpose, I chose the town level information for urban images and county-level information for rural images. In the final images, the area for the rural area was approximately 3 to 3.5 mi2, and the area for the urban area was approximately 2 to 2.75 mi2.

Benefit:

As a geo-locating system, GroundTruth [2] focuses on using crowd’s contribution in order to minimize long extensive manual tasks that the experts have to conduct themselves. The experimental design for this research can help evaluate the performance of the crowd workers while contributing to the geo-locating system GroundTruth. The GroundTruth system can be further modified in accordance with the responses received from the expert journalists. Focusing on the features, which the experts found useful, and modifying the ones where the experts failed to operate could make the system more efficient. Furthermore, our experiment design can be used as a benchmark for future evaluation of other geo-locating systems.

Competition:

The competition for the GroundTruth system are the existing tools that the experts use to verify the image location at present. Currently, the expert journalists use various tools for their verification, starting from Tineye, Acusense, etc. for image verification to Google Map, Wikimapia, TerraServer, etc. for geo-locating images. Although crowdsourcing based site Panoramio has been shut down by Google, another crowdsourced website Wikimapia can be used for investigating the location of an image. Tomnod is another website that uses the help of volunteers to identify an important object and interesting places in satellite images. Additionally, Google’s upcoming Neural Network based PlaNet has the ability to determine the location of an image with great accuracy.

Result:

For the result analysis, I chose two metrics; one is from their performance in geo-locating an image, and another through qualitative and quantitative survey questions. The performance would be analyzed by the completion time and the distance between the selected location and the actual location. The survey questions were set keeping in focus the expects’ reflection about the process, outcome, and their subjective experience of using GroundTruth system.

Discussion:

The experimental design discussed in this research can evaluate the way experts use the GroundTruth system compared to the existing tools. However, there are some potential challenges for the research, such as appropriate image selection, short time-limit, training of the GroundTruth system, backdated satellite imagery, etc. Nonetheless, this research is an initial step to understand the expert’s reflection while using crowdsourcing in geo-locating.

References:

[1] Verification Hand Book by Craig Silverman

[2] Kohler, R., Purviance, J. and Luther, K., 2017. GroundTruth: Bringing Together Experts and Crowds for Image Geolocation.

[3] GeoGuessr.com

Read More

Where Should We Protect? Identify Potential Targets of Terroristic Attack Plan via Crowdsourced Text Analysis

Need, Approach, Benefit, Competition

The increasing volume of text datasets is challenging the cognitive capabilities of expert analysts to produce meaningful insights. Large-scale distributed agents like machine learning algorithms and crowd workers present new opportunities to make sense of big data. However, we must first overcome the challenge of modeling and guiding the overall process so that many distributed agents can meaningfully contribute to suitable components. Inspired by the sensemaking loop, collaboration models, and investigation techniques used in Intelligence Analysis community, we propose a pipeline to better enable collaboration among expert analysts, crowds, and algorithms. We modularize and clarify the components in the sensemaking loop so that they are connected via clearly defined inputs and outputs to pass intermediate analysis results along the pipeline, and can be assigned to different agents with appropriate techniques. We instantiate the pipeline with a location-based investigation strategies and recruited 134 crowd workers on Amazon Mechanical Turk to analyze the dataset. Our results show that the pipeline can successfully guide crowd workers to contribute meaningful insights that are helpful to solve complicated sensemaking challenges. This allows us to imagine broader possibilities for how each component could be executed: with individual experts, crowds, or algorithms, as well as new combinations of these, where each is best suited.

Crowdsourced Text Analysis Pipeline

Result and Discussion

Overview: investigating potential target location of terroristic attack with the pipeline

Step1: Subtly Relevant Documents are Successfully Retrieved

7 documents out of 13 directly mentioned one or more key elements. The remaining 6 documents (3 relevant and 3 irrelevant) are rated by crowd workers in a 0-100 scale. A neutral threshold 50 leads to 11 documents as Step 1 Data Output (precision=90.1%, recall=100%).

Step2: Most Key Useful Information Pieces are Extracted

In Step 2, a total of 26 information pieces are extracted. 18 of the information pieces mentions the target location and the key elements. However, some important information pieces didn’t get extracted.

Step3: Accurate Tagging and Potential Target Identification

After Step 3, 18 out of all the 26 information pieces are tagged, including 5 location tags. One interesting finding is two different workers both identified a location “Tel Aviv” in the information piece “The same brief voice message was given in Arabic in each call. A translation of this message reads: “I will be in my office on April 30 at 9:OOAM. Try to be on time”. One of the workers even give very specific information “the lacation (location) is israel (Israel) at “Mike’s Place”, a restaurant in Tel Aviv”. This means the crowds connect their own knowledge to this analysis.

Step4: Reasonable Reasoning and Comparison

For each location recognized in Step 3, we organize the source information piece to form the profile of this location tag. Then we rank the locations by amount of evidence to prepare for a single-elimination competition. The final winning location is “North Bergen, New Jersey” (the last place the bomb was stored before transferred to the target location), the second place is New York Stock Exchange (the real answer), losing with only one vote.

Logical and Clear Narrative Presentation

Using the profile of “North Bergen, New Jersey”, workers created a narrative as follows:

“A C-4 plastic explosive bomb is to be detonated at 0900hrs on 30 April,2003, by a group of terrorists: Muhammed bin Harazi [alias Abdul Ramazi], Hani al Halak, Hamid Alwan [alias Mark Davis], Sahim Albakri [alias Bagwant Dhaliwal]. Hani al Hallak placed a C-4 plastic explosive bomb and set up a fire in his carpet shop in North Bergen in the early morning hours of April 26, 2003.”

Read More

The Unfortunate Tale of the Lavender Panthers: Injustice, Revenge and the Algorithmic Source of Judicial Errors

Rev. Ray Broshear and his band of 21 homosexuals, cleverly named the Lavender Panthers, patrolled the streets of San Francisco nightly in the early 1970s with chains, batons, and an extensive knowledge of martial arts to protect others in their community from further injustices. Their “flailing ass” approach is just one response of many to when the judicial system fails. Like the Lavender Panthers, when justice is foreclosed, people might resort to self-help, or measures external to the judicial system, such as expressions of disapproval, beatings, and riots [1].

Much has changed since the days of the Lavender Panthers. Beyond a shifting social context, the source of judicial error is gradually becoming increasingly algorithmic. Many facets of the judicial system incorporate predictive risk assessments into their decision-making processes, which classify offenders into risk levels for recidivism. Nominally, the resultant scores counteract some of the errors made by humans [2, 3].  Withal these predictions have their own problems [4-7]. If past human judicial injustices lead people to self-help, will algorithmic injustices similarly motivate the Ray Brashears and Lavender Panthers of the 21st century?

Most likely not, rather it might actually motivate them even more. Psychology and human-computer interaction literature finds that people express preference for human rather than algorithmic forecasting after errors have occurred [8-12]. This preference holds up even when the human forecaster produced 90-97% more errors than the algorithmic forecaster [9]. But will this algorithm aversion apply to the criminal justice system? And, will people exposed to algorithmic-error circumvent the system even more than when faced with human-error?

To answer these questions, I turned to MTurk and randomly assigned 701 respondents into two groups before asking them to read a scenario of low-risk offenders committing more crime after being released into the community. The only difference between the groups was the decision source: either an algorithm or human forecaster. Everyone then indicated their support for extrajudicial activities (see figures 1-3) as well as their attitudes towards the judicial system.

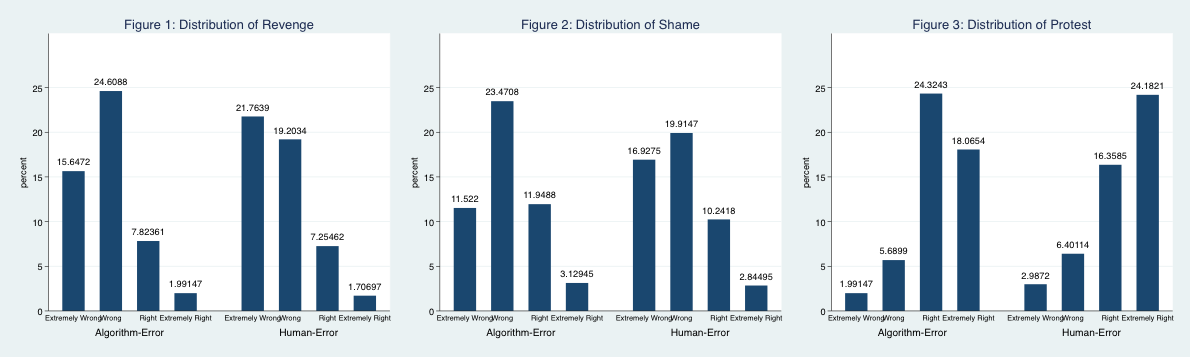
The findings suggest that the source of judicial error does matter. People that read the algorithm error scenario had greater odds of believing revenge and naming and shaming was extremely right. The opposite held true for protesting laws or policies that you think are unjust.

At first glance, it appears that people bypass the system only some of the time. However, if we take a closer look at the motivations behind the self-help behaviors it is possible that people support circumventing the system more often when algorithmic-error is involved.

Remember the Lavender Panthers. They did not see the usefulness of protesting an unwilling system. Instead, physical violence was their approach. People protest when they believe the system can still be changed. They must believe that their actions can influence wider social structures [13, 14]. In contrast, picking up a baton or chain and hitting the streets to “flail ass” does not. Coupled with this efficacy argument, people in the algorithm group could hold the erroneous assumption that algorithms cannot learn from past mistakes [9, 15, 16]. If people hold this belief, then protesting becomes even less efficacious. In other words, why protest to a system that cannot change?

To answer the previous questions, yes and yes. Algorithm aversion does apply to the judicial system. And, yes people exposed to algorithmic-error want to circumvent the system more than when the system appears inaccessible. These findings become concerning with more and more algorithms being used within the system each year, which increases the potential for judicial error from an algorithm that could lead to greater levels of revenge and protest.

References

1          ‘The Sexes: The Lavender Panthers’, in Editor (Ed.)^(Eds.): ‘Book The Sexes: The Lavender Panthers’ (1973, edn.), pp.

2          Baird, C., Healy, T., Johnson, K., Bogie, A., Dankert, E.W., and Scharenbroch, C.: ‘A comparison of risk assessment instruments in juvenile justice’, Madison, WI: National Council on Crime and Delinquency, 2013

3          Berk, R.: ‘Criminal justice forecasts of risk: A machine learning approach’ (Springer Science & Business Media, 2012. 2012)

4          Starr, S.B.: ‘The New Profiling’, Federal Sentencing Reporter, 2015, 27, (4), pp. 229-236

5          O’Neil, C.: ‘Weapons of math destruction: How big data increases inequality and threatens democracy’ (Broadway Books, 2017. 2017)

6          Johndrow, J.E., and Lum, K.: ‘An algorithm for removing sensitive information: application to race-independent recidivism prediction’, arXiv preprint arXiv:1703.04957, 2017

7          Angwin, J., Larson, J., Mattu, S., and Kirchner, L.: ‘Machine bias: There’s software used across the country to predict future criminals. and it’s biased against blacks’, ProPublica, May, 2016, 23

8          Dietvorst, B.J., Simmons, J.P., and Massey, C.: ‘Overcoming Algorithm Aversion: People Will Use Imperfect Algorithms If They Can (Even Slightly) Modify Them’, Management Science, 2016

9          Dietvorst, B.J., Simmons, J.P., and Massey, C.: ‘Algorithm aversion: People erroneously avoid algorithms after seeing them err’, Journal of Experimental Psychology: General, 2015, 144, (1), pp. 114

10        Dzindolet, M.T., Pierce, L.G., Beck, H.P., and Dawe, L.A.: ‘The perceived utility of human and automated aids in a visual detection task’, Human Factors, 2002, 44, (1), pp. 79-94

11        Önkal, D., Goodwin, P., Thomson, M., Gönül, S., and Pollock, A.: ‘The relative influence of advice from human experts and statistical methods on forecast adjustments’, Journal of Behavioral Decision Making, 2009, 22, (4), pp. 390-409

12        Prahl, A., and Van Swol, L.: ‘Understanding algorithm aversion: When is advice from automation discounted?’, Journal of Forecasting, 2017

13        Van Stekelenburg, J., and Klandermans, B.: ‘The social psychology of protest’, Current Sociology, 2013, 61, (5-6), pp. 886-905

14        Gamson, W.A.: ‘Talking politics’ (Cambridge university press, 1992. 1992)

15        Highhouse, S.: ‘Stubborn reliance on intuition and subjectivity in employee selection’, Industrial and Organizational Psychology, 2008, 1, (3), pp. 333-342

16        Dawes, R.M.: ‘The robust beauty of improper linear models in decision making’, American psychologist, 1979, 34, (7), pp. 571

Read More

Assessing Graph Evaluation in a Citizen Science Context

Need

A common task in computational biology is the creation of protein graphs to convey an idea.  These ideas can range from showing molecular complexities of diseases [1] or general layout of cellular components [2].  However, this is sometimes a complex task that can take a significant amount of time for an expert to complete.  In previous work, the Crowd Intelligence Lab at VT has shown that crowdworkers on Amazon Mechanical Turk can create and evaluate this kind of graph.  However, the field of citizen science (like the projects on Zooniverse [3]) has the potential to also be a good source of evaluation, which can allow a refinement feedback loop to create better graphs.


Approach

As previously mentioned, Zooniverse is a website that collects, hosts, and promotes citizen science projects.  In addition, they have a good project wizard that helps budding project managers to easily get projects up and running.  Therefore, I have taken a collection of 78 layouts in .jpg format and uploaded them to Zooniverse.  Then, citizen scientists will execute a workflow that evaluates the graph along several metrics and prompts for qualitative feedback.  A picture of the interface can be seen below.

Benefit

This project aims to benefit biologists and related experts through giving them a tool to enhance and evaluate generated graphs.  This tool should quickly give feedback on issues of aesthetics and readability, which will strengthen any argument they are trying to make with the graph.  Furthermore, citizen scientists are performing analysis on these projects for intrinsic benefits rather than extrinsic benefits (like getting paid).  Previous work has shown that difficult tasks are performed more precisely by citizen scientists than crowdworkers [4], which would should benefit this task.

Competition

Competition comes from many places for crowdworkers in this field.  Currently, there are 69 projects hosted on Zooniverse alone; each citizen science project vies for workers to analyze their data.  Furthermore, this competes with the traditional methods of the expert just laying out the graph themselves and refining as needed.  Some data is proprietary or has other needs to be kept private, so not all biologists will think this is an effective tool.  Lastly, the CrowdLayout tool that was developed previously also competes; getting a crowdworkers to layout graphs in minutes is fairly effective.


Results

Due to Zooniverse’s requirements on projects they promote, this experiment was unable to get to their main page.  However, 161 responses were gathered after promotion via emails and flyers.  Of these responses, 24 were discarded due to being incomplete answers.  Quantitatively, the results are statistically similar after performing Mann-Whitney U-tests on each metric and the overall rating.  Seen below are the boxplots of the data, showing that the averages and confidence.  Qualitatively, I found that 62 of 119 responses (18 did not provide qualitative feedback) were constructive.  This was described as containing some sort of placement or edge suggestions.  Furthermore, there was evidence of problems with the interface (7 responses), malicious users (11 responses), users who didn’t understand the task (8 users), and issues specifically with edge crossings (12 responses).

Overall

Discussion

Zooniverse’s interface and wizard can create a tool that allows for graph evaluation at a similar effectiveness as paid crowdworkers.  Furthermore, the workers created action items in the form of constructive feedback in 52% of ratings.  It was also odd to see malicious responses (as defined by Gadiraju et al. [5]), since these are volunteer-based studies.  In addition, the hurdles that Zooniverse has for promotion on their website makes it difficult to serve as a permanent solution unless the throughput and graph generation increases.


Citations

  1. Baraba ́si, A.-L., Gulbahce, N., and Loscalzo, J. Network medicine: a network-based approach to human disease. Nature Reviews Genetics 12, 1 (2011), 56–68.
  2. Barsky, A., Gardy, J. L., Hancock, R. E., and Munzner, T. Cerebral: a cytoscape plugin for layout of and interaction with biological networks using subcellular localization annotation. Bioinformatics 23, 8 (2007), 1040–1042.
  3. https://www.zooniverse.org/
  4. Mao, A., Kamar, E., Chen, Y., Horvitz, E., Schwamb, M. E., Lintott, C. J., and Smith, A. M. Volunteering versus work for pay: Incentives and tradeoffs in crowdsourcing. In First AAAI conference on human computation and crowdsourcing (2013).
  5. Gadiraju, U., Kawase, R., Dietze, S., and Demartini, G. Understanding malicious behavior in crowdsourcing platforms: The case of online surveys. In Proceedings of the 33rd Annual ACM Conference on Human Factors in Computing Systems, ACM (2015), 1631–1640.

Read More

NextDoor – Facebook lite?

Tech Demo for NextDoor social media platform

Website: www.nextdoor.com

Demo Leader: Lee

Summary:

Nextdoor’s mission is to be the social media platform for your local community, whether that’s a neighborhood, town, or city.  Their tagline is “the private social network for your neighborhood,” and you might confuse it at first as a green-skinned Facebook clone.  Within its pages, you can find similar tabs as Facebook such as “free and for sale,” “events,” and “Groups.”  However, it also has more specific tabs, such as “crime & safety” and directories pages for your locale.

The Nextdoor company lists several reasons why a user might choose to use their app which includes suggestions like “organize a neighborhood watch group” or “find out who does the best paint job in town” and “finally call that nice man down the street by his first name.”  They even describe their mission as to “provide a trusted platform where neighbors work together to build stronger, safe, happier communities.”

Fortunately, users cannot just view any neighborhood’s postings.  They use a verification process where a user must choose 1 of several different ways to prove they live in that area.  Furthermore, the company states that they do not share information about the user-base with any third parties.  However, they do provide advertising functionality as well as some basic statistics on their user-base on the website (60% female, 72% homeowners, 100k average income).

Reflection:

Nextdoor is an interesting idea that faces immense challenges.

Adoption is the biggest hurdle for this company, as it wants to be a social network for neighborhoods.  They try to solve this by aggressively pushing recruitment in their software.  One side-pane always shows the % of your neighborhood that is signed up and there is a leaderboard for how many people you’ve convinced to join their site.  While they absolutely need to have it, adoption is also negatively impacted by their verification processes.  This is performed by a phone call (registered at the address), credit or debit card registration, Social Security number, or postcard.  These forms of verification can damper adoption since they are sensitive (former 3) or slow (latter).

Once registered and on the site, retention is another hurdle.  Blacksburg, for example, is not terribly active on the service.  For my neighborhood (North main) there are 2 posts in the last week.  This is not an app you need to check on every day if you are in a town setting.  However, there are certainly use cases for this app that don’t need to be constantly monitored.  One of the most active tabs is the “lost and found” tab, which contains a lot of missing pet posts.  Related to this is the pet directory, where you can see the pets and their home addresses.  This combination allows for an easy way of finding out who a lost dog or cat belongs to.  Furthermore, there is a tab for regular directory information for your neighborhood, so you can see who lives in what house.

The competition for this site seems stiff; it seems like most of the functionality it provides can either already be reproduced by Facebook or other social networks through minor tweaks.  Facebook already has a “Free and For Sale” tab, local event information, and local business information.  Crime information can also be searched locally on other websites.  Most other social networking sites reach broader audiences, which would make them more attractive for advertising purposes.  A corollary of this idea is that this is just another website to keep a presence on, which might not be worth the additional work.

Overall, Nextdoor is a good idea that may suffer from challenges it faces.

Read More

Tech Demo: LegionTools

Paper:

W.S. Lasecki, M. Gordon, D. Koutra, M.F. Jung, S.P. Dow and J.P. Bigham. Glance: Rapidly Coding Behavioral Video with the Crowd. In Proceedings of the ACM Symposium on User Interface Software and Technology (UIST 2014).

Brief Overview:

When running studies on Amazon Mechanical Turk, we often need a large number of workers in a short amount of time: either to get survey responses quickly or for real-time and synchronous tasks. LegionTools is the answer to this problem. It is a toolkit and interface that can set up a HIT on MTurk through an algorithm that posts and expires a steady stream of HITs (that all point to the same task), to quickly gather a large number of Turkers.

It can also pool these workers in a “waiting room” of sorts, and a selected subset (or all) of these workers can be routed to a real-time synchronous task, with the push of a button.

Download Link: https://github.com/cromaLab/LegionTools or http://rochci.github.io/LegionTools/

Steps (taken from LegionTools GitHub page):

  1. Add a new task by typing a unique session name, title, description, keywords, and clicking Add new task. Remember your session name, you can use it to pull up your session later on.
  2. Set the target number of workers. Set the price range and click “Update price”.
  3. Click Change waiting page instructions to edit the text that workers will be shown while waiting for your task.
  4. Click Start recruiting to beging recruiting. You must click Stop recruiting to end the recruiting process. Note that stopping recruitment will take some time, depending on your target number of workers.
  5. Pull up a previous task using just your task session name. If you closed the UI page and left the recruiting tool running, you may stop that recruiting process by loading the associated session and clicking Stop recruiting.
  6. Modify task title, description, and keywords with Update. Changes automatically affect all new HITs posted by the recruiting tool.
  7. Send workers to a URL with the Fire button. Your chosen URL must be HTTPS.
  8. When you are ready to review completed HITs, click Reload in the Overview section to load all reviewable HITs associated with a given task session.


Read More

Demo: Snopes.com


Snopes.com

Category: Fact Checking

Link: https://www.snopes.com/

Demo Leader: Ri

Summary:

Snopes.com is one of the first online fact-checking websites, which was featured in NPR in August 2005 as the “Urban Legends Reference Pages”. Created by David and Barbara Mikkelson in early 1995, which later became Snopes.com. The website became popular as an early online encyclopedia focused on urban legends. It also got its very television plot in 2002 under the name Snopes: Urban Legends.

The site aims at either debunking or confirming widely spread urban legends. The site was also referenced by various news media, like CNN, MSNBC, Fortune, Forbes, and NY Times on multiple occasions.

Apart from verifying or debunking urban legends, the website also features news articles regarding various topics, like Political News, Crime, Controversy, Entertainment News, Conspiracy Theories, etc.

Reflection:

Currently, there are several fact-checking websites, like Factcheck.org, Politifact.com, etc. Among these websites, one of the earliest one is Snopes.com. Even the site has been proven to have nonpolitical affiliation by another site Factcheck.org [2].

I found the website to be richly populated by various topics and urban legends. I liked the fact that without even creating an account, one can browse through the latest urban legends and learn about their veracity. The site also verifies many of the urban legends in a short period of time like 2/3 days. One can verify the stories at a glance as they are mentioned upfront under the news’ image. Their description of the stories and the verification process are also quite elaborate.

I, however, found there “Hot 50” list a little bit confusing. They did not mention anywhere on the site (not to my knowledge) how they ranked this list. One of my intuition was that the ranks are generated automatically by the number of views, shares, and/or date. However, I found contradictions to that notion. At the time of my exploration, “Did an Iranian Woman Undergo 50 Plastic Surgeries to Resemble Angelina Jolie?” [3] was on the #1 post in the Hot 50 posts. Although there was another post, namely “Did Tokyo Open the First Human Meat Restaurant?” [4], which had more share counts and was more latest from the dating perspective. Interestingly, I also found that the later news was fact-checked by David Mikkelson, the creator of the Snopes.com website himself.

How to:

  1. Go to the URL: https://www.snopes.com/.
  2. The website allows you to search the site based on keywords or URLs.
  3. Searching something by keywords returns the urban legends which have been fact-checked by the website. The search results then can be filtered by Category (Fact Check, News), Authors, and from the certain time period (All time, Last week, Last month, Last year).
  4. The left navigation bar contains several features, which the website offers, like what’s new, hot 50, fact check, news, etc.
  5. Click on the “What’s New” option to get the latest fact checked urban legends.
  6. You can also find Most Searched urban legends on the right side of the website. Each post is assigned the number of shares they got so far. There is a similar strip on the side regarding Most Shared urban legends.
  7. By clicking the “Hot 50”, you can see the list of news that is currently ranked as top 50 posts. Inside every post, there is Claim, Rating (True/False), and Origin describing the urban legend. The post also contains the share count for that particular post along with sharing options to different social media, like Facebook, Twitter, Google+, Pinterest, etc.
  8. You can click on the “Fact Check” option to get a list of urban legends fact-checked by the Snopes associates. The list of the legends is arranged from latest to the oldest. Each of the posts contains an image above which the category of the news is also mentioned, like Fauxtography, Viral Phenomena, Technology, etc.
  9. You can click on the “News” option to get a list of news written by the Snopes associates. Sometimes, they also feature news article from other online news media, like apnews.com. The list of the news is arranged from latest to the oldest. Each of the posts contains an image above which the category of the news is also mentioned.
  10. In the “Video” option, you can find the posts containing videos.
  11. In the “Archive” option, there are many posts all listed under different categories.
  12. By clicking the “Random” option, you will be provided with a random fact-checking post from the website.
  13. There is also several tags on the top strip of the website.
  14. You can subscribe to the Snopes.com via your email to get daily updates by clicking the option “Get the Newsletter”.

References:

[1] Snopes.com: Debunking Myths in Cyberspace – NPR.org

[2] “Is Snopes.com run by “very Democratic” proprietors?” – FactCheck.org

[3] Did an Iranian Woman Undergo 50 Plastic Surgeries to Resemble Angelina Jolie? – Snopes.com

[4] Did Tokyo Open the First Human Meat Restaurant? – Snopes.com

Read More

Demo: Social Searcher

Social Searcher

Category: Tech Visualization

Link: https://www.social-searcher.com/

Demo Leader: Ri

Summary:

Social Search is a behavior of retrieving and searching on a social searching engine that mainly searches user-generated content such as news, videos and images related search queries on social media like Facebook, LinkedIn, Twitter, Instagram, and Flickr [1]. It was originally created as www.facebook-search.com on June 2010 and later migrated to www.social-searcher.com on May 2011. The site itself is not affiliated with social media companies like Facebook, Twitter, or Google. The site allows users to search publicly posted information on Twitter, Google+, Facebook, YouTube, Instagram, Tumblr, Reddit, Flickr, Dailymotion, and Vimeo. All these public information can be browsed via the site without the need of logging in or creating an account. However, a registered free user gets some benefits. Such as, saving their searches, setting up email alerts, etc. A premium-registered user can avail him/herself of premium features, such as saving social mentions history, exporting data, API integration, advanced analytics, immediate email notifications, etc. [2]

Reflection:

I think such real-time search engine for social media can be used to a great extent by the journalists. It can also reflect the public sentiment over a particular topic. As mentioned in the article [3] by Journalism UK, the Android app for social searcher became the “App of the week for journalists”.

I really liked the visualization of the data presented on the website. The interactive interface along with rich information was a delight to use.

I, however, was confused about the way they filtered the sentiment of the posts. In many cases, I found dissimilarities between the post and its assigned sentiment.

One another thing that intrigued me is that the site has this tool called “HOT Trends”, where articles about latest trends are supposedly listed. However, at the time of my personal exploration (December 2017), I found all of the hot trended articles to be dated back to 2015. I could not fathom how such outdated articles could be listed as “HOT Trends”. It also leads me to the belief that these articles might have been manually trended as such and are currently not properly monitored and updated.

Their special projects also seemed to be quite outdated having the latest project article dated March 2014.

How to:

  1. Go to the URL: https://www.social-searcher.com/
  2. Type in the search box. This invokes one of the site’s tools called “Social Buzz”. This tool can also be accessed from the footer of the website.
  3. The searches can be made based on Keywords, Exact Keywords, and Minus Keywords via the Keywords Tab.
  4. You can specify the sources from which they want the information from via Sources Tab. In addition, you can mention specific Facebook URL as the source.
  5. You can further select the types of the posts, such as link, status, photo, and/or video in the More tab.
  6. In the Filter Search, you can also provide the above parameters, like the types of the posts and selection of sources. In addition to these, you can filter the searches based on sentiment (Positive, Negative, and/or Neutral). Positive sentiment is colored by Green, whereas, Negative and Neutral are colored as Red and Grey respectively.
  7. Each of the posts allows you to go to the original post or share the post via the three-dotted-option at the right bottom corner of each post.
  8. In order to see the detailed statistics with data visualization, you can click on the button “Detailed Statistics”. This will populate the data based on the criteria, general, sentiment, users, links, types, and keywords.
  9. You can also export the data from the more option.
  10. You can finally check out the other features in the footer of the website, such as, blog, pricing, about, plugins, API, etc. to get a better idea about their system.

References:

[1] Social Search, definition by WIKIPEDIA

[2] Social Searcher, the official page.

[3] “App of the week for journalists” – by Journalism UK

Read More

An Update on NLTK — Web Based, GUI NLTK via WebNLP!

Tool: WebNLP at http://dh.mi.ur.de/

My demonstration tomorrow is essentially a re-do of my earlier NLTK demo. For this round, I’ve been looking at the tool WebNLP. Unfortunately, the website on which it is hosted hasn’t been loading all evening. The white paper that accompanies this tool is very interesting, and reflects some of my experiences trying to work with NLTK as a humanities/social sciences researcher. Hopefully the site will be up again soon, but for everyone’s edification, I thought that a blog post about the WebNLP white paper would be productive.

Here’s the paper: https://www.researchgate.net/publication/266394311_WebNLP_-_An_Integrated_Web-Interface_for_Python_NLTK_and_Voyant

This includes a description of WebNLP’s functionalities, but is also a rationale for the development of a web-based GUI NLTK program. The authors write:

 Most of these [NLP] tools can be characterized as having a fairly high entry barrier, confronting non-linguists or non-computer scientists with a steep learning curve, due to the fact that available tools are far from offering a smooth user experience (UX)…

The goal of this work [the development of WebNLP] is to provide an easy-to-use interface for the import and processing of natural language data that, at the same time, allows the user to visualize the results in different ways. We suggest that NLP and data analysis should be combined in a single interface, as this enables the user to experiment with different NLP parameters while being able to preview the outcome directly in the visualization component of the tool. (235-236)

They go on to describe how WebNLP works, visualized in this graphic:

Visualization of WebNLP functionality

As we can see, WebNLP joins Python NLTK with the program Voyant to create a user-friendly (i.e. no coding or command line interface requirements) tool for NLP that is sophisticated enough for scholarly research. The fact that it’s web-based seems to be a benefit, too; I’d imagine that a local application would require the user to install Python, which could be problematic.

WebNLP is based on JavaScript and the front-end framework Bootstrap. I don’t know if it’s open source — I couldn’t find it on Github and the paper doesn’t mention that. As far as I can tell, the only place it is hosted is at the link shared above. It doesn’t seem extremely difficult to implement, and given its potential usefulness, I (of course!) think that it should be hosted at a stable site — or that the code should be opened up to allow other to host WebNLP applications and iterate on it. Right now, it is limited to sentence tokenization, part-of-speech tagging, stop-word filter, and lemmatization. I think there is more that NLTK can do. The visualization output, meanwhile, can produce the following: Wordclouds, bubblelines, type frequency lists, scatter plots, relationships and type frequency charts. Even just as an experiment or learning tool, it might be useful to think about how else these data might be visualized.

All this being said, I really do hope http://dh.mi.ur.de/ returns soon. In any case, it’s encouraging to see that something I thought should already exist… already does. And the paper has been useful for my semester-long project.


Read More