Demo: Global Database of Events, Language, and Tone (GDELT)
Summary:
The Global Database of Events, Language, and Tone (GDELT) is an open-sourced service supported by Google Ideas. It is a massive index of news media from 1979 to today, including real-time data from across the world. Articles are machine-translated into English (if not already) and then algorithms are applied to identify various events, sentiment, people, locations, themes and much more. The coded metadata is then streamed and updated every 15 minutes.
To work with the data, GDELT Analysis Service provides various ways to visualize and explore the data, such as EVENT Exporter, EVENT Geographic Network, EVENT Heatmapper, EVENT Timeline, EVENT TimeMapper, GKG Network, GKG Network, GKG Country Timeline, GKG Exporter, GKG Geographic Network, and many others. Datasets can also be moved into Google BigQuery, a cloud data warehouse, to run SQL queries, or downloaded as raw data files in CSV formats.
One of the main advantage to GDELT is the collection of real-time data from around the world. This data is coded and openly available for all to use. Not only that, but GDELT Analysis Service provides easy-use visualization tools for people not as familiar with programming. However, GDELT, like many other applications, can be used for nefarious ways. For example, regimes could track and record political protests and potentially use GDELT’s data to predict future protests. This would be particularly problematic in countries that would otherwise lack the data collection capacity to do such monitoring on their own.
Demo:
As mentioned above, GDELT is capable of so many different things. The following demonstration will be for only one of its services. Let’s explore a geographic heat map of protests that happened in Canada in the past year …
- Head to GDELT Analysis Service
- Click EVENT HeatMapper
- At this stage, you need to fill in your email address (so the results can be forwarded on to you) as well as the information of interest. For this example, let’s choose a start date of 10/24/2016 and an end date of 10/24/2017. Then we choose civilian for ‘recipient/victim (Actor2) Type’. The event location should be specified to Canada and the event code should be ‘protest’. We also want the number events as the location weighting because we are interested in number of unique events rather than number of news articles. Lastly, let’s choose interactive ‘Interactive Heatmap Visualization’ and ‘.CSV File’ for the output. Then click submit.
- Now you wait until the results show up on your metaphorical door step…
- And, magic! It appears. Now you can see the results as a CSV or the Heatmap by clicking
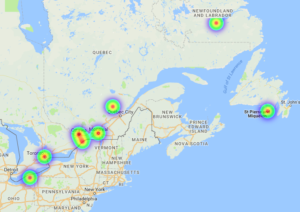 either link. Let’s look at the HeatMap first. The slide bar is to adjust display thresholds. If we zoom in, we can see protests occurred in Southern Ontario, Toronto, Ottawa, Montreal, outside Quebec City and even some in Newfoundland and Labrador.
 - The CSV provides us with the longitude, latitude, and place name. In addition, it provides the number of events. For example, Marystown, Newfoundland had four protests. I did a simple Google search to see what was happening and it appears that fishermen were protesting at the union office.
Again, this is only one of the many tools available on GDELT.