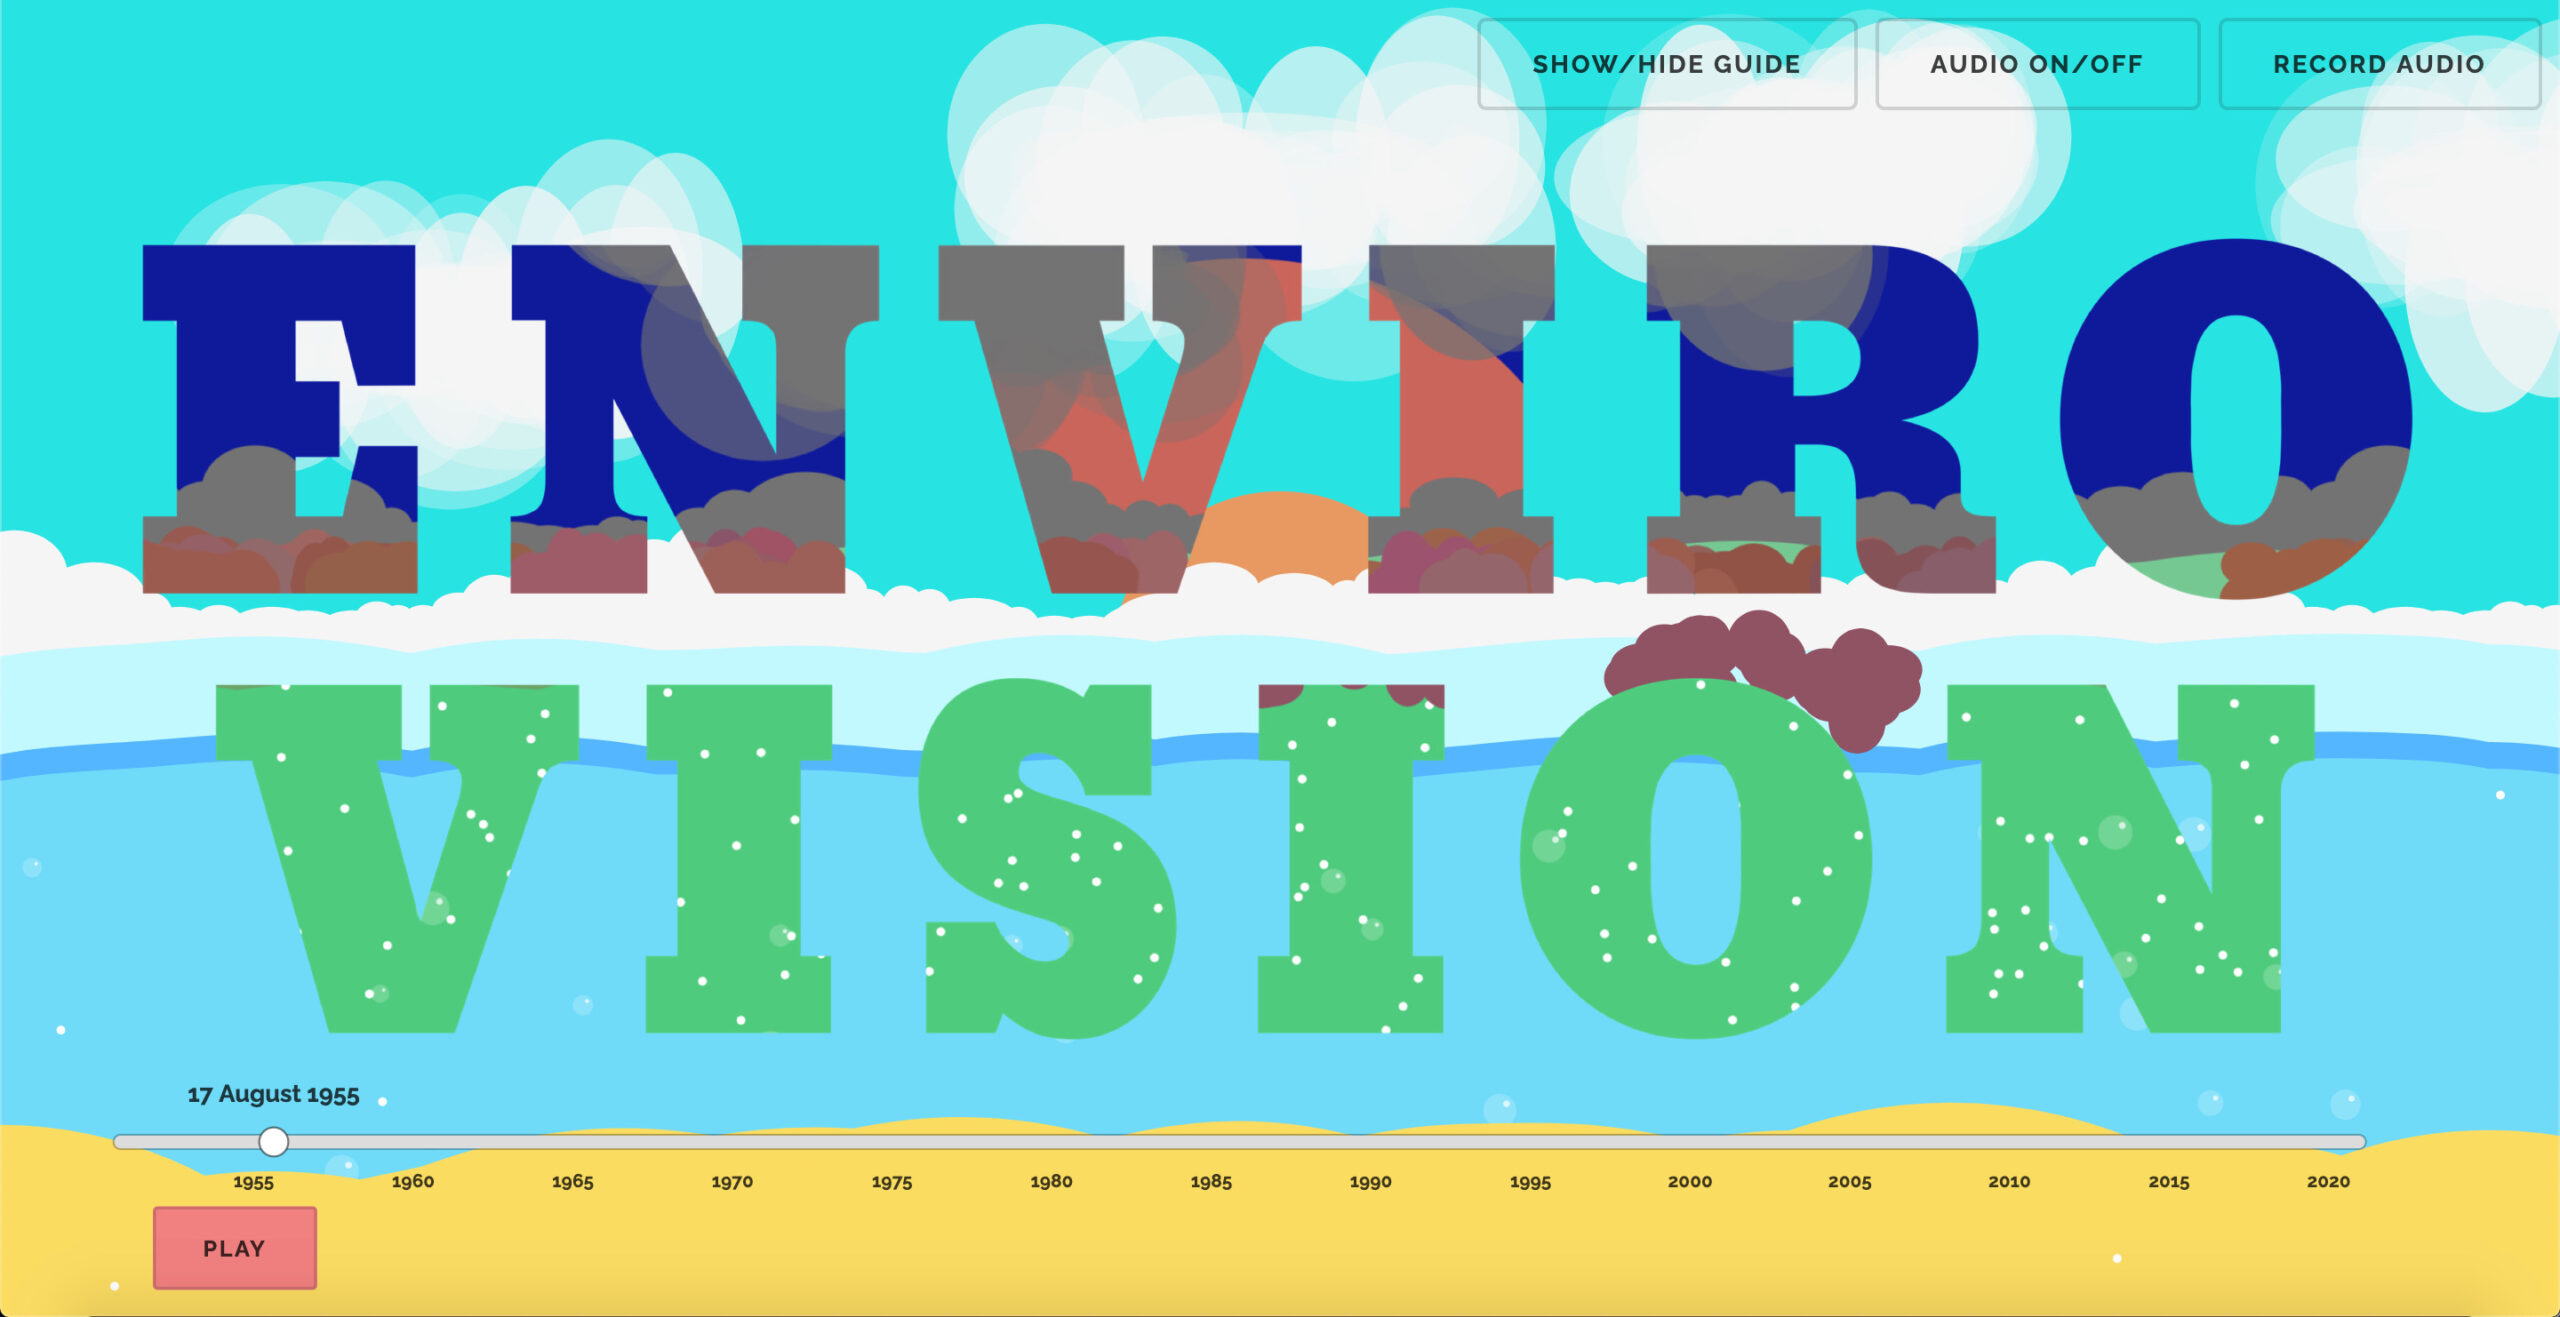
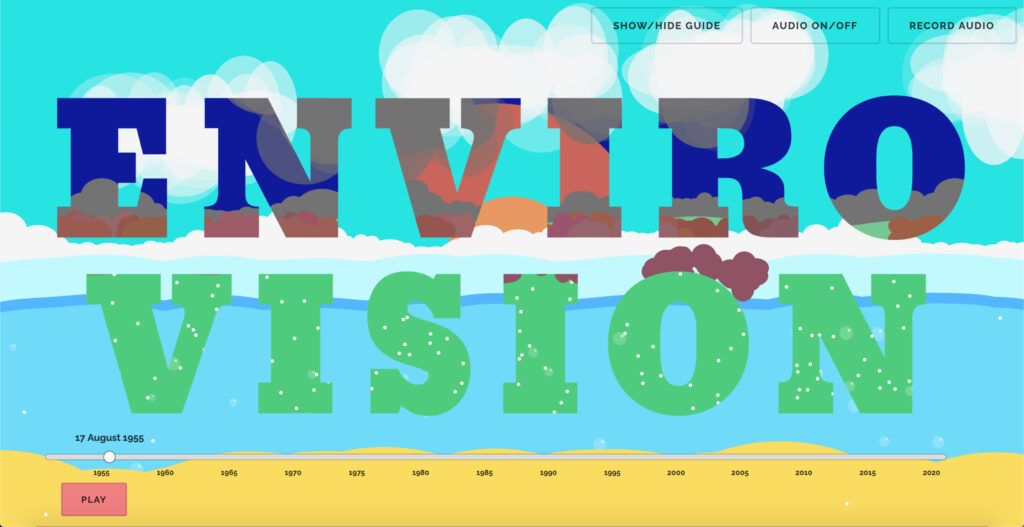
Project Title: ENVIROVISION
URL: https://samiea.github.io/Envirovision
Team: Samie Amriui, Quinn Eggleston, Rachel Hachem, Tim Kueny
Artist statement
Over the years, harmful pollutants have been exposed to our environment, particularly in recent times, causing worrisome ripples and concerns for the future of our natural world. We have some degree of awareness concerning growing levels of pollution in our atmosphere and oceans, but visually perceiving the impact of pollutants in the environment is not an easy task. This challenge may be due to difficulty for untrained eyes measuring increasing levels of pollutants in our environment on the basis of numbers alone.
Our ambition was to create a 2D dynamic webpage where sonifications and visualizations based on live data are reflected in the objects present on the screen that users can engage with. These objects are auditory and kinetic representations of changing climate and pollution levels over time for global ocean and weather data. By presenting sonifications and visualizations of the effects climate change and pollutants have and how those effects will accelerate in their severity, we want to encourage creators and users alike to be more environmentally conscious and inspire change that would contribute to a cleaner and healthier Earth.
- Data:
- We used carbon dioxide, methane, nitrous oxide and average global temperature derived from global-warming.org. We used this to change sun size and color, size of clouds and the color of the sea and sky as well as the audio. We demonstrate sea level to rise with data acquired from the EPA, and micro/macro plastic data from ourworldindata.org.
- Additionally, it is very seldom that people hear data as well; certain auditory data is normal, such as the beeping of a heartbeat monitor in a hospital or an old clock bell tolling to tell the hour, but rarely is it presented in a similar fashion as data visuals are. In this project, we added an optional audio component that uses the same data that is being used to determine the visuals, and translates it into sound.
- The detune spread of the bass sound’s multiple oscillators is controlled by the temperature, the overall bass detune is controlled by the sea level, the probability of a consonant vs dissonant interval as defined by medieval counterpoint rules is controlled by the microplastic level, the number of partials of the treble synthesizer is controlled by the macro plastic levels, and distortion and reverb effects are inversely controlled by the carbon levels.
- Visuals and sounds: Interact with moving objects on the visualization to display value representation of pollutants corresponding with the current period in time.
- Audio: The audio adjusts intervals, detune, partials and effects processing based on the incoming data.
- Bubbles: The bubbles rising up through the ocean represent methane entering the atmosphere, and increase and decrease in number accordingly.
- Ocean Color: The color of the ocean is based on ocean pollution data, darkening as levels in the ocean increase.
- Ocean Level: The sea level rises or descends based on sea level data
- Microplastics: The small white dots drifting downward through the ocean represent microplastics, tiny plastic particulates polluting the oceans. They increase and decrease in number based on microplastic levels in the oceans.
- Macroplastics: The large brown and grey shapes on the ocean surface represent macroplastics, larger plastic objects polluting the oceans. They increase and decrease in number based on macroplastic levels in the oceans.
- Sky Color: The color of the sky is based on carbon dioxide data, darkening as CO2 levels in the atmosphere increase.
- Smog: The grey smog clouds increase and decrease in density, size, and number based on nitrous oxide levels in the atmosphere.
- Sun Size: The sun increases and decreases in size based on global temperature averages – larger means hotter, smaller means cooler.