Reflection #14 – [04/17] – [Vartan Kesiz-Abnousi]

[1] Lelkes, Y., Sood, G., & Iyengar, S. (2017). The hostile audience: The effect of access to broadband internet on partisan affect. American Journal of Political Science61(1), 5-20.

1. Summary

The main purpose of this paper is to identify the causal impact of broadband access on affective polarization by exploiting differences in broadband availability brought about by variation in state right of-way regulations (ROW), which significantly affect the cost of building Internet infrastructure and thus the price and availability of broadband access. The data on right-of-way laws come from an index of these laws. The data on broadband access are from the Federal Communication Commission (FCC). For data on partisan affect, we use the 2004 and 2008 National Annenberg Election Studies (NAES). For media data, they use comScore. Their results suggest that had all states adopted the least restrictive right-of-way regulations observed in the data, partisan animus would have been roughly 2 percentage points higher. Finally, they demonstrate that an alternative set of instruments for broadband availability (surface topography) yields very similar results.

2. Reflections

The authors start the paper by trying to convince the readers that polarization, partisanship is increasing. For instance, they mention that partisan prejudice exceeds implicit racial prejudice [2] (Iyengar and Westwood 2014). I skimmed that paper and the data is publicly available on Dataverse, it’s cross-sectional. There is no actual proof of that statement, and it was not necessary. As the authors stress: “In contemporary America, the strength of these norms has made virtually any discussion of racial differences a taboo subject to the point that citizens suppress their true feelings” [2].

My point is, this entire “increase in polarization” depends on:

  1. When do we start the “counter” (the clock)?
  2. Establishing causal relationship between X factor(s) an “polarization” is not easy. Especially when are trying to isolate one factor: broadband internet.

In addition, the phrase “media consumption is strongly elastic, increasing sharply with better access”, should have probably stressed that it is “elastic with respect to internet speed”, which is what the authors meant. In general, people tend to associate elasticity with price, and I doubt media consumption is not “strongly elastic” with respect to price.

2. 1. Assumptions

“[..] access to broadband primarily increases the size of the pie, without having much impact on the ratio of the individual slices.  Assuming patterns of consumption remain roughly the same, any increase in consumption necessarily means greater exposure to imbalanced political information.

This is a bold assumption. I am not sure how we can assume something like that and there are no citations whatsoever to back this up. To put thing into perspective, this means “your grandfather’s generation media consumption pattern is roughly the same as yours, Millennials”

Another assumption is the following:

“Right of-way regulations (ROW), which significantly affect the cost of building Internet infrastructure and thus the price and availability of broadband access.”

While this make “sense”, there are huge theoretical leaps here. Here is why ROW (A) implies cost of infrastructure (B) but does not imply price and availability (C): cross-subsidization. Corporations can “afford” reducing the prices in specific areas to increase their market share even if the initial costs are high. This is quite common in the telecommunication and broadband services.

2.2. Technical issues

While the authors test the “strength” of the instrument in a somewhat crude way, they do not test anything else which is problematic. Specifically, I didn’t see any test anywhere regarding the validity of the instrument. There is a citation provided for a dissertation thesis that also has no test. For future reference, this is a framework on how to go forward when you decide to utilize IV/2SLS methodologies based on the Godfrey-Hutton Procedure:

  1. Weak Instrument Test (or strength of instrument)
    1. One way is to implement Godfrey’s two step method and get “Shea’s Partial R square”.
  2. Over-identification Test (validity test/instrument exogeneity)
    1. Sargan’s Overidentification Test (sometimes called J test)
  3. If pass step 1 and 2 proceed with a Hausman Test
    1. This confirms the existence of endogeneity.

Questions

  1. Are we now more polarized as a country than during the Vietnam War? If the answer no, what does this mean? I doubt there was broadband internet back then.
  2. Two assumptions that I mention in the main text.
    1. Patterns of consumption remain the same?
    2. The increase in costs does not necessarily affect the price of broadband internet.
  3. Technical issues, lack of a validity test which might yield biased results.

Read More

Reflection #11 – [04/10] – [Vartan Kesiz-Abnousi]

[1] Pryzant, Reid, Young-joo Chung and Dan Jurafsky. “Predicting Sales from the Language of Product Descriptions.” (2017).

[2] Hu, N., Liu, L. & Zhang, J.J. “Do online reviews affect product sales? The role of reviewer characteristics and temporal effects”.  Inf Technol Manage (2008) 9: 201. https://doi.org/10.1007/s10799-008-0041-2

Summary [1]

As the title suggest, the authors’ main goal is to predict sales by examining which linguistic features are more effective. The hypothesis is that product descriptions have a significant impact on consumer behavior. To test this hypothesis, they mine 93,591 product descriptions and sales records from a Japanese e-commerce website. Subsequently, they build models that can explain how the textual content of product descriptions impacts sales. In the next step they use these models to conduct an explanatory analysis, identifying what linguistic aspects of product descriptions are the most important determinants of success. An important aspect of this paper is that they are trying to identify the linguistic features by controlling for the effects of pricing strategies, brand loyalty and product identity. To this end, they propose a new feature selection algorithm, the RNN+GF. Their results suggest that lexicons produced by the neural model are both less correlated with confounding factors and the most powerful predictors of sales.

Reflections [1]

This has been a very interesting paper. Trying to control for confounding factors in an RNN setting is something that I haven’t seen before. The subsequent analysis by utilizing a mixed model was also a very good choice. Technically speaking, this paper is not that easy to follow because it requires a wide range of knowledge from different disciplines: deep learning, excellent knowledge of statistical modeling (i.e. mixed models and all the tests and assumptions) and knowledge from consumer theory.

It should be stressed that when textual features are regarded as fixed effects, this implies that they are invariant for the log of sales, which is the dependent variable. This makes sense for the authors because they believe that by adding the brand and the product as random effects they control for every other effect. Perhaps they could have controlled for seasonal effects, albeit since the data is a snapshot for only a month, it is understandable why the authors didn’t do it.

I am not certain how the authors ensure that the random effects, brand and product, are not correlated with the rest of variables.

Questions [1]

  1. Comparison of the results to a baseline RNN model? I wonder how would that work.
  2. Chocolate and Health products have different transaction and information costs compared to the clothing industry. Would the linguistic results for E-commerce hold for other industries?


Summary [2]

In this study, we investigate how consumers utilize online reviews to reduce the uncertainties associated with online purchases. The authors adopt a portfolio approach to our investigation of whether customers of Amazon.com understand the difference between favorable news and unfavorable news and respond accordingly. The portfolio comprises products and events (favorable and unfavorable) that share similar characteristics. The authors find that changes in online reviews are associated with changes in sales. They also find that, besides the quantitative measurement of online reviews consumers pay attention to other qualitative aspects of online reviews such as reviewer quality and reviewer exposure. In addition, they find that the review signal moderates the impact of reviewer exposure and product coverage on product sales

Reflections [2]

Another interesting paper. The authors use the concept of “transaction costs”. In addition to the transaction costs that are mentioned in the theory, there is another one that is known as “search cost”, although they touch the subject indirectly when they introduce the uncertainty theory. The amount of time consumers will dedicate to search more information about a product is bounded, and it is related to their “opportunity cost”. In general, this cost is lower in E-commerce than in other markets (for instance, going from one grocery store to another induces large search costs). In general, an E-commerce market is considered to be closer to the “ideal” perfect market, than the traditional markets, because all these transaction costs that distort the market and are mentioned in the paper are lower. Overall, as far as I am aware, Amazon.com tags user reviews with a “verified purchase”. I wonder if the authors took this into account. In addition, I have the same criticism as in the previous paper. In this case, the authors used book, DVDs and videos. These are entertainment products with very similar transaction costs attached to them. It is unclear whether these results can hold for other products.

Question [2]

Extension: See if the results hold for products that belong into a different category other than entertainment.

Read More

Reflection #11 – [03/27] – [Vartan Kesiz-Abnousi]

[1] Hiruncharoenvate, Chaya, Zhiyuan Lin, and Eric Gilbert. “Algorithmically Bypassing Censorship on Sina Weibo with Nondeterministic Homophone Substitutions.” ICWSM. 2015.

[2] King, Gary, Jennifer Pan, and Margaret E. Roberts. “Reverse-engineering censorship in China: Randomized experimentation and participant observation.” Science 345.6199 (2014): 1251722.


Summary[1]


The paper published by King and colleagues in 2014, researchers did not understand how the censorship apparatus works on sites like SinaWeibo, which is the Chinese version of Twitter. The censored weibos censored weibos were collected for the duration between October 2, 2009-November 20, 2014 and is comprised with approximately 4.4K weibos. The two experiments that the authors use rely on this dataset. Namely, an experiment on Sina Weibo itself and a second experiment where they ask trained users from Amazon Mechanical Turk to recognize the homophones. The second dataset consists of weibos from the public timeline of Sina Weibo, from October 13,2014–November 20,2014, accumulating 11,712,617  weibos.


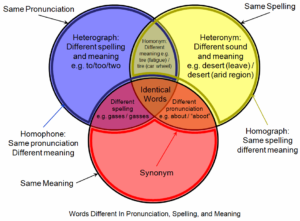
Venn diagram showing the relationships between homophones (blue circle) and related linguistic concepts


Reflections[1]

I’ve never heard of the term “homophone” before. Apparently, such as decomposition of characters, translation, and creating nicknames—to circumvent adversaries, creating Morphs have been in wide usage. Homophones are a subset of such morphs. The Venn Diagram also provides further insight. Overall, three questions are asked. First, are homophone-transformed posts treated differently from ones that would have otherwise been censored? Second, are homophone-transformed posts understandable by native Chinese speakers? Third, if so, in what rational ways might SinaWeibo’s censorship mechanisms respond? One question that I have is whether utilizing tf-idf score is the best possible choice for their analysis. Why not an LDA? I didn’t find a discussion regarding this choice of the model, even though it is detrimental to the results. The algorithm, as the authors suggest, has a high chance to generate homophones that have no meaning since they did not consult a dictionary.  I find this to also have a serious impact in the model.  This might look like a detail, but I think it might have been a better idea to keep the Amazon Turk instructions only in Mandarin, instead of asking in English that non-Chinese speakers not to complete the task.  It would have been helpful if we had all the parameters of the logit model in a table. Regardless, they find that


Questions[1]

  1. Is the usage of homophones particularly that widespread in mandarin, compared to the Indo-European Language Family? Furthermore, can these methods be applied to other languages?
  2. How much of a complex conversation can occur with the usage of homophones? Is there language complexity metric, with complexity defined as some metric that conveys ideas effectively?
  3. An extension of the study could be the study of the linguistic features of posts containing homophones.


Summary [2]

The paper written by King et al has two parts. First, they create accounts on numerous Chinese social media sites. Then, they randomly submit different text and observe which texts are censored and which weren’t. The second task involves the establishment of a social media site, that uses Chinese media’s censorship technologies. Their goal is to reverse engineer the censorship process. Their results support a hypothesis, where criticism of the state, its leaders, and their policies are published, whereas posts about real-world events with collective action potential are censored.


Reflections [2]

This is an excellent paper in terms of causal inference and the entire structure. Gary King is a notorious author in experimental design studies aimed to draw causal inference. For the experimental part, first they introduce blocking based on the writing style. I didn’t find much about the writing style on the supplemental material. They also have a double dichotomy, that produces four experimental conditions: pro- or anti-government and with or without collective action potential. It is the randomization that allows to draw causal claims in the study.

Questions [2]

  1. How do they measure the “writing style”, when they introduce blocking?

Read More

Reflection #10 – [03/22] – [Vartan Kesiz-Abnousi]

Topic: Bots & Sock puppets

Definitions:
Sockpuppets: “fake persona used to discuss or comment on oneself or one’s work, particularly in an online discussion group or the comments section of a blog” [3]. Paper [1] defines it  as “a sockpuppet as a user account that is controlled by an individual (or puppetmaster) who controls atleast one other user account.” They [1] also use the term “sockpuppet group/pair to refer to all the sockpuppets controlled by a single puppetmaster”.
BotsInternet Bot, also known as web robot, WWW robot or simply bot, is a software application that runs automated tasks (scripts) over the Internet.” [4]
Summary [1]
The authors [1] study the behavior of sockpuppers. The research goal is to identifying, characterizing, and
predicting sockpuppetry. This study [1] spans across nine discussion communities. They demonstrate that sockpuppets differ from ordinary users in terms of their posting behavior, linguistic traits, as well as social network structure. Moreover, they use the IP addresses and user session data and identify 3,656 sockpuppets comprising 1,623 sockpuppet groups, where a group of sockpuppets is controlled by a single puppetmaster. For instance, when studying “avclub.com”, the authors find that sockpuppets  tend to interact with other sockpuppets, and are more central in the network than ordinary users.  Their findings suggest a dichotomy in the deceptiveness of sockpuppets:  some  are pretenders, that masqueradeas separate users, while others are non-pretenders, that is sockpuppets that are overtly visible to other members of the community. Furthermore, they find that deceptiveness is only important when sockpuppets are trying to create an illusion of public consensus. Finally, they create a model to automatically identifying sockpuppetry.
Reflections [1]
Of the 9 nine discussion communities that were studied, their is a heterogeneity with respect to: a) the “genre”, b) the number of users and c) the percentage of sock-puppets. While these are interesting cases to study, none of them are “discussion forums”. Their main function as websites, and business model, is not to be a discussion platform. This has several ramifications. For instance, “ordinary” users, and possibly moderators, who are participating in such websites might find it more harder to identify “sock-puppetry”, because they can not observe their long-term behavior, as they could in a “discussion forum”.
Their analysis focuses on sockpuppets groups that consist of two sockpuppets. However, neither sockpuppets groups that consist of three or even four sockpuppets are not neglible. What if these sockpuppets demonstrate a different pattern? What if a multitude of sockpuppets of 3, 4 and beyond,  is more likely to engange in systematic propaganda? This is a hypothesis that would be interesting to explore.
I also believe that we can draw some parallels from this paper with another paper that we reviewed in this class regarding “Antisocial Behavior in Online Discussion Communities” [5]. For instance, their definitions are different regarding the definition of “threads” etc. As a matter of fact, two of the authors in both papers are the same, [1] Justin Cheng and Jure Leskovec. Furthermore, in both papers they use “Disqus”, which is the commenting platform that hosted these discussions. Would the results generalize in something else than “Disqus”? This, I believe, remains a central question.
The “matching” by utilizing the propensity score is questionable. The propensity score is a good matching measure only when we account/control for all the factors i.e. we know the “true” propensity score. This does not happen in the real world. It might be a better idea to add “fixed-effects” and restrict the matches to a specific time wedge, i.e. match observations within the same week to control for seasonal effects.  The fact that the dataset is “balanced” after the matching does not consist of evidence that the matching was done correctly.  It is the features they used for matching  (i.e. “the similar numbers of posts and make posts to the same set of discussions) that should be balanced, not the “dataset”. They should have had at least a QQ plot that shows the ex-ante and ex-post matching performance. A poor matching procedure will result into bad inputs into their subsequent machine learning model, in this case random forest. Note that the authors performed the exact same matching procedure in their previous 2015 paper [5]. Apparently nobody pointed this out.
Questions [1]
 
[Q1] I am curious as to why the authors decided take the following action: “We also do not consider user accounts that post from many different IP addresses, since they have high chance of sharing IP address with other accounts“. I am not sure whether I understand their justification. Is their research that backs up this hypothesis? No reference is provided.
In general, remove outliers, for the sake of removing outliers, is not a good idea. Outliers are removed usually when a researcher believes when a specific portion of the data is an wrong data entry i.e. a housing price of $0.
[Q2] A possible extension would be to explore the relationship beyond sockpuppets groups that consist of only two sockpuppets.
[Q3] There is no guarantee that the matching was done properly, as I analyze in the reflection.
Summary [2]
The authors propose and evaluate a novel honeypot-based approach for uncovering social spammers in online social systems. The authors define social honeypots as information system resources that monitor spammers’ behaviors and log their information. The authors propose a method to automatically harvest spam profiles from social networking communities, the development robust statistical user models for distinguishing between social spammers and legitimate users and filtering out unknown  (including zero-day) spammers based on these user models. The data is drawn from two communities, MySpace and Twitter.
Reflections [2]
While I was reading the article, I was thinking of the IMDB ratings. I have observed that there have been a lot of movies, usually controversial, that receive ratings only ratings that in the extremes of the rating scale, either “1” or “10”. Or in some other cases, movies are rated, even though they have still not been publicly released. Which fraction of that would be considered a “social spam” though? Is a mobilization of an organized group that is meant to down-vote a movie a “social spam” [6]?
Regardless, I think it is very important to make sure ordinary users are not classified as spammers, since this could have a cost on the social networking site, including their public image. This means that their should be an acceptable “false positive rate”, tied to the trade-off between between having spammers and penalizing ordinary users, a concept known in mathematical finance as “Value at risk (VaR)”.
Something that we should stress is that in the MySpace random sample, the profiles have to be public and the about me information has to be valid. I found the interpretation of the “AboutMe” feature as the best predictor given by the authors very interesting. As they argue, it is the most difficult feature for a spammer to vary because it contains the actual sales pitch or deceptive content that is meant to target legitimate users
Questions [2]
[Q1] How would image recognition features perform as predictors?
[Q2] Should an organized group of ordinary people who espouse an agenda be treated as “social spammers”?
References
[1] Kumar, Srijan, et al. “An army of me: Sockpuppets in online discussion communities.” Proceedings of the 26th International Conference on World Wide Web. International World Wide Web Conferences Steering Committee, 2017.
[2] Lee, Kyumin, James Caverlee, and Steve Webb. “Uncovering social spammers: social honeypots+ machine learning.” Proceedings of the 33rd international ACM SIGIR conference on Research and development in information retrieval. ACM, 2010.
[5] CHENG, J.; DANESCU-NICULESCU-MIZIL, C.; LESKOVEC, J.. Antisocial Behavior in Online Discussion Communities. International AAAI Conference on Web and Social Media, North America, apr. 2015. Available at: <https://www.aaai.org/ocs/index.php/ICWSM/ICWSM15/paper/view/10469>.

Read More

Reflection #9 – [02/22] – [Vartan Kesiz-Abnousi]

First Paper Reviewed
[1] MITRA, T.; COUNTS, S.; PENNEBAKER, J.. Understanding Anti-Vaccination Attitudes in Social Media. International AAAI Conference on Web and Social Media, North America, mar. 2016. Available at: <https://www.aaai.org/ocs/index.php/ICWSM/ICWSM16/paper/view/13073/12747>. Date accessed: 21 Feb. 2018.

Summary

The authors examine the attitudes of people who are against vaccines. They compare them with a pro-vaccine group and to their differences with the people are just joining the anti-vaccination camp. The data is four years of longitudinal data from Twitter, capturing vaccination discussions on Twitter. They identify three groups: those who are persistently pro vaccine, those who are persistently anti vaccine and users who newly join the anti-vaccination cohort. After fetching each cohort’s entire timeline of tweets, totaling to more than 3 million tweets, we compare and contrast their linguistic styles, topics of interest, social characteristics and underlying cognitive dimensions.  Subsequently, they built a classifier to determine positive and negative attitudes towards vaccination. They find that people holding persistent anti-vaccination attitudes use more direct language and have higher expressions of anger compared to their pro counterparts. Adopters of anti-vaccine attitudes show similar conspiratorial ideation and suspicion towards the government.

Reflections

The article stresses that alternative methods should be adopted (non-official sources) in order to change the opinion of those who belong in the anti-vaccination group. However, this would work on the targeted groups who have anti-vaccination attitudes. If the informational method changes, it might have adverse effects, in the sense that it might revert pro-vaccination people into anti-vaccination.

I wonder if they could use unsupervised learning and perform and explorative analysis in order to find more groups of people. In addition, I didn’t know that population attitudes extracted from tweet sentiments has been shown to correlate with traditional polling data.

For the first phase, the authors use snowball samples. However, such samples are subject to numerous biases. For instance, people who have many friends are more likely to be recruited into the sample. I also find it interesting that the final set of words basically included a permutation of the words: mmr, autism, vaccine and measles. Is this what anti vaccination groups mainly focus on? The authors use a qualitative examination and find that trigrams and hashtags were prominent cues of a tweet’s stance towards vaccination. Interestingly enough, only “Organic Food” is statistically significant both Between Groups and Within Time.

Questions

  1. What kind of qualitative examination made the authors choose trigrams and hastaghs as the prominent cues of a tweet’s stance towards vaccination?
  2. I wonder whether the authors could find more than the three groups by using an unsupervised learning method.
  3. The number of Pre-Time Tweets are significantly less than Post-Time Tweets. Was that intentional?


Second Paper Reviewed

[2] Choudhury, M.D., Counts, S., Gamon, M., & Horvitz, E. (2013). Predicting Depression via Social Media. ICWSM.

Summary

The mail goal of the paper is to predict Major Depressive Disorder (henceforth MDD), as the title suggests, through social media. They author collect their data via crowdsourcing, specifically Amazon Turk. They ask them to complete a standardized depression form (CES-D) and they compare the answers to another standardized form (BID) in order to see whether they are correlated. They quantify the user’s behavior through their Twitter posts. They include two groups those who do suffer from depression and those who do not and they compare the two groups. Finally, they build a classifier that predicts MMD which has an accuracy of 70%.

The authors suggest that Twitter posts contains useful signals for characterizing the onset of depression in individuals, as measured through decrease in social activity, raised negative affect, highly clustered egonetworks, heightened relational and medicinal concerns, and greater expression of religious involvement.

Reflections

It should be noted that the classification is based on the behavioral attributes of people who already had a depression. Did they ask them for how long they suffer from a major depression disorder? I imagine someone who has been diagnosed for having depression years ago might have different behavioral attributes compared to someone who has been diagnosed a few months ago. In addition, being diagnosed as having depression is not equivalent to the actual onset of depression.

What if they collected the pre-depression onset tweets and compare them with the post-depression tweets? That might be an interesting extension. In addition, since the tweets are from the same individuals, factors that do not change temporarily could be controlled.

Something that puzzles me is their seemingly ad-hoc choice of onset dates. Specifically, they keep individuals with depression onset dates anytime in the last one year, but no later than three months prior to the day the survey was taken. Are they discarding individuals who have depression onset dates for more than one year? There is an implicit assumption that people who suffer from MMD are homogeneous.

Questions

  1. Why do they keep depression onset dates within the last year? Why not go further back?
  2. There is an implicit assumption by the authors. That people who suffer from a MDD are the same (i.e. homogeneous). Is someone who suffers from MDD for years the same as someone suffers for a few months? This lack of distinction might affect the classification model.
  3. An extension would be to study the twitter posts of the people who have MDD through time. Specifically, pre-MDD vs post-MDD behavior, for the same users. Since they are the same users, they will be able to control for factors that do not change through time.

Read More

Reflection #8 – [02/20] – [Vartan Kesiz-Abnousi]

Reviewed Paper

Kramer, Adam DI, Jamie E. Guillory, and Jeffrey T. Hancock. “Experimental evidence of massive-scale emotional contagion through social networks.” Proceedings of the National Academy of Sciences 111.24 (2014): 8788-8790.

Summary

The authors an online social platform, Facebook, and manipulated the extent to which people were exposed to emotional expressions in their News Feed. Two parallel experiments were conducted for positive and negative emotion: One in which exposure to friends’ positive emotional content in their News Feed was reduced, and one in which mood posture to negative emotional content in their News Feed nature, reduced. Posts were determined to be positive or negative if they contained at least one positive or negative word, as defined by the Linguistic Inquiry and Word Count. Both experiments had a control condition, in which a pro portion of posts in their News Feed were omitted random (i.e., without respect to emotional

The experiments took place for 1 week (January 11 January 18). In total, over 3 million posts were analyzed. Participants were randomly selected based on their User ID, resulting in a total of ~155,000 participants per condition who posted at least one status update during the research period.


 Reflections

I am skeptical on whether “emotional contagion” has a scientific basis. Therefore, I am even more skeptical about it an online framework.  I am going to assume for the rest of the paper that it is indeed “well-established”, the words that the authors use.

How about non-verbal posts i.e. images? For instance, people have a tendency to “post” images that do contain texts, that reflect their emotions or thoughts. How about people who post songs that reflect a specific emotional state? For instance, I assume Johnny Cash’s “Hurt” does not invoke the same emotions with “Macarena”.

Two dependent variables pertaining to emotionality expressed in people’s status updates. The authors initially choose Poisson regression. This is sometimes also referred as “log-linear” model. It’s used when the dependent variable is “counts” or frequencies, while there is a linear relationship between with the independent variables. The authors argue that a direct examination of the frequency of positive and negative words is not possible because the frequencies would be confounded with the change in overall words produced. Subsequently, they revert to a different method, a weighted linear regression in which there is a dummy variable that separated control and treated observations. The coefficient of this dummy variable is statistically significant, providing support that emotions do spread through a network.

 Questions

  1. What if the posts had images that have texts? What if they had song tracks?
  2. The network structure is not taken into account. For instance, when does the emotional effect “die out”?

Read More

Reflection #7 – [02/13] – Vartan Kesiz-Abnousi

Review:

Niculae, Vlad, et al. “Linguistic harbingers of betrayal: A case study on an online strategy game.” arXiv preprint arXiv:1506.04744 (2015).

Summary

The authors are trying to find linguistic cues that can signal revenge. To this end, they use online data for a game called “Diplomacy”. The users are anonymous. The dataset is ideal in that friendships, betrayals and enmities are formed and there is a lot of communication between the users. The authors are interested on Dyad communications, between two people. Subsequently, this textual communication might provide some verbal cues for an upcoming betrayal. As the authors suggest, they do find that certain linguistic cues, such as politeness, leads to betrayals.

Reflections

I have never played the game and I had to read the rules in order to understand it. The research focus is on Dyad communication and betrayal. But are the conversations public, or private? Can the players see you communicating with someone? To get a better understanding I read the rules of the game and the answer is as follows:In the negotiation phase, players communicate with each other to discuss tactics and strategy, form alliances, and share intelligence or spread disinformation about mutual adversaries. Negotiations may be made public or kept private. Players are not bound to anything they say or promise during this period, and no agreements of any sort are enforceable.”[1]. Subsequently, there is an extra layer of choice besides communication, on whether the negotiations are private or public. These choices might be not captured on Dyad communications.

The authors make a serious point with respect to game theoretic decision making models that attempt to model decision making and interactions. However, I believe that the approach of the authors and the game theoretic approaches are complementary and do not necessarily contradict each other. “Decision theory” is a highly abstract, mathematical, discipline and the models are rigorous in the sense that they follow the scientific method of hard sciences. In addition, just for clarification, the vanilla Prisoners Dilemma is not a “repeated game” as the authors stress. It can’t be formulated as a repeated game however the Nash Equilibrium changes when that happens. Something that should be stressed is that this is not a “repeated game”. The online game was not repeatedly played with the same players over and over again. Had the players played the game repeatedly, eventually they might have changed their behavioral strategies. This in turn might have affected the linguistic cues. In game theory, repeated games, as in games with the same agents and rules that are played over and over again, have different equilibria than static games. Subsequently, I am not sure if the method can be even generalized for this particular game, let alone other games where the rules are different for this reason.

Idiosyncrasy/rules of the game. Eventually, in order to win you need to capture all the territories. Thus the players anticipate that you might eventually become their enemy. This naturally has an impact on the interactions. In the real world, you don’t expect – at least me – to be surrounded by enemies who want to “conquer your territories”. The game induces “betrayal incentives”. If we design the game differently, it is likely that the linguistic predictive features that signal “betrayal” will change. There is a field called “Mechanism Design” dedicated to see how changing the rules of a game yield different results (“equilibria”).

The authors focus on friendships that have at least two consecutive and reciprocated acts of friendship. Should all acts of friendship count the same way? Are some acts of friendship more important than other acts? In other words, should there be a “weight” on an act of friendship?

The authors focus on the predictive factors of betrayal. I wonder, how can we use this in order to inform people on how to maintain friendships. The article makes an implicit assumption that friendships necessarily end due to betrayals. This is natural, because these terms used in the content of “Diplomacy” (the game). In the real world, there could many reasons why friendships can end. It would be interesting to develop a predictive, behavioral, algorithm that predicts the end of friendships because of misunderstandings.

The authors are trying to understand the linguistic aspects of betrayal and as a result, they do not use game specific information. However, if this information is not taken into account, then it is likely that the model will be wrong. By controlling for these effects, we can have a clearer picture of the linguistic aspects of betrayal.

Questions

  1. What if the players read this paper before they play the game? Would this change their linguistic cues?
  2. Should all acts of friendship count the same way? Are some acts of friendship more important than other acts?
  3. What if the authors did control for game specific information as well? Would this alter the results? Based on some models for the same game, it seems that if you select some countries, you will ultimately have to betray your opponent. For instance, “adjacency” is apparently an important factor that determines friendships and enmities. An adjuscency map can be seen in the attached map.[2]
  4. What if the users knew each other and played the game again and again, rendering the game repeated? Would this change the linguistic cues, after obtaining information regarding the behavioral patterns from the previous rounds?
  5. Can players visually see other players interacting and the length of that interaction? What if they can?

[1] Wikipedia

[2] http://vizual-statistix.tumblr.com/post/64876756583/i-would-guess-that-most-diplomacy-players-have-a

Read More

Reflection #6 – [02/08] – Vartan Kesiz-Abnousi

[1] Danescu-Niculescu-Mizil, C., Sudhof, M., Jurafsky, D., Leskovec, J., & Potts, C. (2013). A computational approach to politeness with application to social factors. arXiv preprint arXiv:1306.6078.

[2] Voigt, R., Camp, N. P., Prabhakaran, V., Hamilton, W. L., Hetey, R. C., Griffiths, C. M.,  & Eberhardt, J. L. (2017). Language from police body camera footage shows racial disparities in officer respect. Proceedings of the National Academy of Sciences, 201702413.

The Danescu et al paper proposes computational framework for identifying and characterizing aspects of politeness marking in requests. They start with a corpus of requests annotated for politeness, specifically two large communities Wikipeidia and StackExchange. They use this to construct a politeness classifier. The classifier achieves near human-level accuracy across domains, which highlights the consistent nature of politeness strategies

The reason Danescu et al use requests are because they involve the speaker imposing on the addressee, making them ideal for exploring the social value of politeness strategies and because they stimulate negative politeness. I believe there should be a temporal aspect There is surely a qualitative difference between Wikipedia and StackExchange. The type of requests has a different nature on those two communities. This might explain the result.

Second, there is a problem I believe with respect to the generalizing this theory in the “real world”. An online community is quite different compared to a real life community, for instance a University or a corporation. In online communities people are not only geographically separated, but is truly the worst thing that can happen to someone who is not polite on Wikipedia, or Stack Exchange compared to an office environment? There would be consequences that go beyond a digital reputation. I would also be interested to conduct an experiment in those communities. What if we “artificially” established fake users with extraordinary high popularity with the same requests as users who have extremely low popularity? How polite would people respond?

Technically, there is a big difference in the number of requests on the two domains, WIKI and SE. The same size of requests from SE is ten time larger. Therefore, what puzzles me is why did they use Wikipedia as their training data instead of Stack Exchange. Why did they not use Stack Exchange

In addition, the annotators were told that the sentences were from emails of co-workers. I wonder what kind of effect that has on the results. Perhaps the annotators have specific expectations of “politeness” from co-workers that would not be the same if they knew that they were examining requests from Wikipedia and SE. Second, I see that the authors are doing a “z-score normalization” on an ordinal variable (Likert scale) which is statistically wrong. You cannot take the average of an ordinal variable. That includes the standard deviation. And nothing indicates an average of 0 in Figure 1. Instead of doing that, they can either simply report the median or use an IRT (Item Response Model) model with polytomous outcomes, which appropriate for Likert scales. In addition, while the inter-annotator agreement is not random based on the test they perform, the mean correlation is not particularly high either. Just because it is not random, does not mean that there is a consensus.

And why is the inter-annotation pairwise correlation coefficient around 0.6? The answer is different people have different notions of what they deem as “polite”. If the authors collected the demographics of the annotators, I believe we would see some interesting results. First, it might have improved the accuracy of the classifiers drastically. Demographics such as income, education, the industry that they work could have an impact. For instance, does someone who works in the Wall Street pit in Manhattan has the same notion of “politeness” as a nun?

In the second paper, henceforth Voight et al, as the title suggests, the authors investigate language from police body camera footage shows racial disparities in officer respect. They do this we analyze the respectfulness of police officer language toward white and black community members during routine traffic stops.

I believe this paper is related a lot to the previous paper on many levels. Basically, the language displays the perceived power differential between the two (or more) agents who are interacting. Most importantly, it is the fact that there is no punishment, or there are no stakes that further bolsters such behaviors. For instance, once people lose their elections, they become politer. The power of this paper is that it is using real camera footage, not an online platform. Based on the full regression model in the Appendix, apologizing makes a big difference in the “Respect” and “Formal” models. The coefficients are both statistically significant and signs are reversed, apologizing is positive with respect, as expected.

Read More

Reflection #5 – [02/06] – Vartan Kesiz-Abnousi

Papers

[1]. Garrett, R. Kelly. “Echo chambers online?: Politically motivated selective exposure among Internet news users.” Journal of Computer-Mediated Communication2 (2009): 265-285.

[2]. Bakshy, Eytan, Solomon Messing, and Lada A. Adamic. “Exposure to ideologically diverse news and opinion on Facebook.” Science6239 (2015): 1130-1132.

Summary

In Baksy’s et al 2015 paper, the main question is: how do online networks influence exposure to perspectives that cut across ideological lines? They focus only on Facebook. To this end, they assemble data shared by U.S. users over a 6-month period between 7 July 2014 and 7 January 2015. Then, they measure ideological homophily in friend networks and examined the extent to which heterogeneous friends could potentially expose individuals to cross-cutting content They construct an indicator score, “Alignment”, that ranks sources based on their ideological affiliation. They quantify the extent to which individuals encounter comparatively more or less diverse content while interacting via Facebook’s algorithmically ranked News Feed and further studied users’ choices to click through to ideologically discordant content. They find that compared with algorithmic ranking, individuals’ choices played a stronger role in limiting exposure to cross-cutting content.

In Garret’s 2009 paper, the author examines whether the desire for opinion reinforcement may play a more important role in shaping individuals’ exposure to online political information than an aversion to opinion challenge. In doing so, data collected via a web administered behavior-tracking study over a six-week period in 2005. The subjects were recruited from the readership of 2 partisan online news sites. The results demonstrate that opinion-reinforcing information promotes news story exposure while opinion-challenging information makes exposure only marginally less likely.

Reflection

Baksy et al published in 2015, is dealing with contemporary events that are widely discussed. The role of social media has been at the epicenter of due to its, according to some, significant impact in shaping the political landscape of the United States. Compared with algorithmic ranking, individuals’ choices played a stronger role in limiting exposure to cross-cutting content Subsequently, one question that begs an answer is whether these results remain the same now

Baksy et al specifically focused on Facebook, there is a caveat that I wonder whether the research took into account on whether people actually “Follow” their friends. For instance, what about the information users are exposed to by the things their Friends like, or share? Is this considered part of the “News Feed”? I would argue that this might have more significant effect on “Echo Chambers” than the algorithmically ranked news feed. Even in this case, you only see a subset of what your “friends” share, the friends that you actually “follow”. In addition, how about the information that you receive by the “groups” that you “follow”? I am not sure if the paper addressed this issue.

In addition, individuals may read the summaries of articles that appear in the News Feed and therefore be exposed to some of the articles’ content without clicking through.

I also find it interesting that for both liberals and conservatives the median proportion of friendships of the people on the opposite spectrum is roughly the same, around 20% following the 20/80 Pareto principle.

In Garret’s I found the experimental design particularly thoughtful an interesting, including the fact that they had screening questions. However, it should be stressed that they examine the issue of echo chambers only the in the context of politics. The dependent variable is the “use of issue related news”. It should be noted that they measured the dependent variable by their “interest in reading” and “read time”. From modeling perspective, it appears that Garret is using a “mixed model”, which is a statistical model containing both “fixed effects” and “random effects”. It might have been a good idea to include control for time trends, since there is a time wedge of six weeks in the study. Possibly including a dummy for each week would make the results more robust, although I can understand that from the author’s view 6 weeks is a short period. Still, individual fixed-effects control only for factors that remain constant between those 6 weeks.

For the logit model that examines “story selection”, the “opinion challenge” variable in the logit model has a p-value 5% to 10%. Therefore, for that model I believe the readers should place more emphasis on the results regarding “opinion-reinforcement” variable.

I wonder whether there should be some guidebook or manual that would warn and instruct us how to search information on the web-search engines. However, I don’t believe that opinion-reinforcing web searches belief is tantamount to an echo chamber. To put it bluntly, if the users are conscious that they conducting an opinion-reinforcing web-search, then what’s wrong with that? Nothing. There are degrees of “echo chambers” and whether there is critical threshold by which an echo chamber is harming the user is yet to be seen. For instance, opinion-reinforcing web search on medical issues has serious ramification on public health. Such qualitative factors impart a different contextual meaning of what an “echo-chamber” is and its ramifications. Moreover, such qualitative factors should be taken into account. The quantitative models must include more information distinctions than just “hard” or “soft” news.

Finally, I have a broader skepticism that transcends the main goal of the Baksy et al paper. Facebook, and other social media websites, are under fire for bolstering “fake news”. This criticism -financial incentive to force social media platforms to rank them higher than smaller media outlets. This is called the “principal-agent” problem in corporate finance. There should healthy skepticism.

Questions

  1. The study was conducted in 2015. Would these results hold today?
  2. How about effect of “Following” your friends? Does this take into account the information that you are exposed to?
  3. What are the factors the about the order which users see stories in the News Feed? Do they weigh the same way?
  4. There is a qualitative aspect on “echo-chambers”. The distinction of information should be more than “hard” or “soft” news. There might be an “echo-chamber” on information related to politics but not on medical/health issues. When the stakes are high, i.e. your health, are any of the hypotheses listed on Garret’s paper validated? My hunch is not. This qualitative heterogeneity is not addressed properly. I believe this requires further investigation.

Read More

Reflection #4 – [01/30] – [Vartan Kesiz-Abnousi]

Zhe Zhao, Paul Resnick, and Qiaozhu Mei. 2015. Enquiring Minds: Early Detection of Rumors in Social Media from Enquiry Posts. In Proceedings of the 24th International Conference on World Wide Web (WWW ’15). International World Wide Web Conferences Steering Committee, Republic and Canton of Geneva, Switzerland, 1395-1405. DOI: https://doi.org/10.1145/2736277.2741637


Summary

The authors aim to identify trending topics in social media, even topics that are not pre-defined. They use Twitter as their source of data. Specifically, they analyze 10,417 tweets related to five rumors. They present a technique to identify trending rumors. Moreover, they define them into topics that include disputed factual claims. Subsequently, they deem the identification of trending rumors as soon as possible important. While it is not easy to identify the factual claims on individual posts, the authors redefine the problem in order to deal with this. Therefore, they find cluster of posts whose topic is a disputed factual claim. Furthermore, when there is a rumor there are usually posts that raise questions by using some signature text phrases. The authors search for these keywords in order to identify them such as: “Is this true?”. As the authors find, many rumor diffusion processes have some posts that have such enquiry phrases quite early in the diffusion. Subsequently, the authors develop a rumor detection method that looks for the enquire phrases. It follows five steps: identification of signal tweets and signal clusters, detect statements, capture non-signal tweets, and rank candidate rumor clusters. Therefore, the method clusters similar posts together and finally collects the related posts that do not contain the enquire phrases. Next, they rank the clusters of posts by their likelihood of really containing a disputed factual claim. The detectors find that the method has a very good performance. About a third of the top 50 clusters were judged to be rumors, a high enough precision


Reflections


The broad success of online social media has created fertile soil for the emergence and fast spread of rumors.  A notable example is that one week after the Boston bombing, the official Twitter account of the Associated Press (AP) was hacked. The hacked account sent out a tweet about two explosions in the White House and the President being injured. Subsequently, the authors have an ambitious goal. They propose that instead of relying solely on human observers to identify trending rumors, it would be helpful to have an automated tool to identify potential rumors. I find the idea of identify rumors in real time, instead of retrieving all the tweets related to them, very novel and intelligent. To their credit, the authors acknowledge that identifying the truth value of an arbitrary statement is very difficult, probably as difficult as any natural language processing problems. They stress that their goal does not make any attempt to assess whether rumors are true or not, or classify or rank them based on the probability that they are true. They rank the clusters based on the probability that they contain a disputed claim, not that they contain a false claim.


I am particularly concerned regarding the adverse effect of automated rumor detection. In particular, its use in either damage control or disinformation campaigns. The authors write: “People who are exposed to a rumor, before deciding whether to believe it or not, will take a step of information enquiry to seek more information or to express skepticism without asserting specifically that it is false”. However, this statement is not self-evident. For instance, what if the flagging mechanism of a rumor, “disputed claim”, does not work for all cases? Government official statements would probably not be flagged as “rumors”. A classic example is the existence, or lack thereof, of WMD’s in Iraq. Most of the media corroborated with the government’s (dis)information. To put things into more technical terms, what if the twitter posts do not have any of the enquiry phrases (i.e. “Is this true?”)? The clusters would then not detect them as “signal tweets”. In that case, the automated algorithm would never find a “rumor” to begin with. The algorithm would do what it was programmed to do, but it would have failed to detect rumors.


Perhaps the greatest controversy is surrounded by how “rumor” is defined. According to the authors, “A rumor is a controversial and fact-checkable statement”. By “Fact-checkable”: In principle, the statement has a truth value that could be determined right now by an observer who had access to all relevant evidence. By “Controversial (or Disputed)”: At some point in the life cycle of the statement, some people express skepticism. I think the “controversial” part might be the weakest part of the definition. Would the statement “earth is round” be controversial because at “some point in the life cycle of the statement, some people express skepticism”? The authors try to recognize such tweets into a category they label as “signal tweets”.

Regardless, I particularly liked the rigorous definitions provided in the “Computational Problem” section that leaves no room for misinterpretation. There is room for research in the automated rumor detection area. Especially if it could broaden the “definition” of rumor and somehow embed it in the detection method.

Questions

  1. What if the human annotators are biased in manually labeling rumors?
  2. What is the logic regarding the length of the time interval? Is it ad hoc? How sensitive are the results to the choice of time interval?
  3. Why was Jaccard similarity coefficient set to a 0.6 threshold? Is this the standard in this type of research?


Mitra, Tanushree, Graham P. Wright, and Eric Gilbert. “A parsimonious language model of social media credibility across disparate events.” Proceedings of the 2017 ACM Conference on Computer Supported Cooperative Work and Social Computing. ACM, 2017.


Summary

The main goal of this article is to examine whether the language captured in unfolding Twitter events provide information about the event’s credibility. The data is a corpus of public Twitter messages with 66M messages corresponding to 1,377 real-world events over a span of three months, October 2014 to February 2015. The athors identify 15 theoretically grounded linguistic dimensions and present a parsimonious model that maps language cues to perceived levels of credibility. The results demonstrate that certain linguistic categories and their associated phrases are strong predictors surrounding disparate social media events. The language used by millions of people on Twitter has considerable information about an event’s credibility.

Reflections

With the ever increasing doubt on the credibility of information found on social media, it is important for both citizens and platforms to identify such non-credible information. My intuition before even completing the paper was that the type language used in Twitter posts could be used an indicator to capture the credibility of an event. Furthermore, even though not all non-credible events can be captured just by language, we could still be able to capture a subset. Interestingly enough, the authors indeed verify this hypothesis. This is important in the sense that we can capture non-credible posts with a parsimonious model through a first “screening model”. Then, after discarding these posts we could proceed to more complex models to add additional “filters” that detect non-credible posts. One of the dangers that I find is to make sure not to eliminate credible posts, a false positive error, with “positive” being non-credible error. The second important contribution is that instead of retrospectively identifying whether the information is credible or not, they use CREDBANK in order to overcome dependent variable bias. The choice of Pca Likert scale renders the results interpretable. In order to make sure that the results make sense, they compare this index with hierarchical agglomerative clustering. After comparing the two methods, they find high agreement between our Pca based and HAC-based clustering approaches.

Questions

As the authors discuss, there is no broad consensus of the meaning of “credibility”. In this case credibility is the accuracy of the information.  In turn the accuracy of information is examined by instructed raters. The authors use an objective definition of credibility that is dependent on the instructed raters. Are there other ways to assess “credibility” based on “information quality”? Would that yield different results?


Garrett, R. Kelly, and Brian E. Weeks. “The promise and peril of real-time corrections to political misperceptions.”

Summary

This paper presents an experiment comparing the effects of real-time corrections to corrections that are presented after a short distractor task. Closer inspection reveals that this is only true among individuals predisposed to reject the false claim. The authors find that individuals whose attitudes are supported by the inaccurate information distrust the source more when corrections are presented in real time, yielding beliefs comparable to those never exposed to a correction.

Reflections

I find it interesting Providing factual information is a necessary, but not sufficient, condition for facilitating learning, especially around contentious issues and disputed facts. Furthermore, the authors claim that individual are affected by a variety of biases and that can lead them to reject carefully documented evidence, and correcting misinformation at its source can actually augment the effects of these biases. In Behavioral Economic there is a term that describes this biases. It is called “Bounded Rationality”. Furthermore, economic models used to assume that humans make rational choices. This “rationality” was formalized mathematically and then Economists create optimization problems that takes into account human behavior. However, new Economic models take into account the concept of bounded rationality into their Economic models through various ways. Perhaps it could be useful for the authors to draw some information from this literature.

Question?

1. Would embedding the concept of “Bounded Rationality” provide a theoretical framework for a possible extension of this study?

Read More