Reflection #14 – [04/17] – [Hamza Manzoor]

[1] Lelkes, Y., Sood, G., & Iyengar, S. (2017). The hostile audience: The Effect of Access to Broadband Internet on Partisan Affect. American Journal of Political Science, 61(1), 5-20.

In this paper, Lelkes et al. used exogenous variation in access to broadband internet stemming from differences in right-of-way laws, which significantly increase the access to content because it affects the cost of building internet infrastructure and thus the price and availability of broadband access. They used this variation to identify the impact of broadband internet access on partisan polarization. The data was collected from various sources. The data on right-of-way laws come from an index of these laws. The data on broadband access is from the Federal Communication Commission (FCC). For data on partisan affect, they use the 2004 and 2008 National Annenberg Election Studies (NAES). For media data, they use comScore and they use Economic Research Service’s terrain topology to classify the terrain into 21 categories. The authors find that the access to the broadband internet increases partisan hostility and boosts partisans’ consumption of partisan media. The results of their study show that if all the states had adopted the least restrictive right-of-way regulations, partisan animus would have been roughly 2 percentage more.

I really liked reading the paper and their analysis was very thorough. While reading the paper, I had various doubts regarding the analysis but they kept on clearing those doubts as I kept on reading. For example, when they compared the news media consumption using broadband and dial-up connection, they did not discuss the number of users in each group of 50,000 users but later they use CEM that reduces the imbalance on set covariates. CEM (Coarsened Exact Matching) seems like a good technique for the imbalance in the dataset. CEM is a Monotonic Imbalance Bounding (MIB) matching method which means that the balance between the treated and control groups is chosen by the user based on forecasts rather than discovered through the usual laborious process of checking after the fact and repeatedly re-estimating.

Anyway, the authors still made many assumptions in the paper. People visiting a left-leaning website are considered left-leaning and vice versa. Can we naively assume that? I have been on Fox news a few times and if I was under study at that period of time, I would be considered a conservative (which I am not). Secondly, the 50,000 panelists knew that they were under study and their browsing history was recorded. This might have induced bias because people who know that their activity is monitored won’t browse as they normally do. Another interesting thing in the paper was that only 3% of Democrats say that they regularly encounter liberal media whereas, 8% of Republicans say the same. In case of Republicans, it is more than double. What could be the reason? Even in dial-up, the difference is significant between groups and secondly, does that mean that Republicans are more likely to polarize? This difference reduces in case of broadband (19% and 20%).

Another interesting analysis was performed on internet propagation with respect to the terrain. Though the authors did not claim any such thing, they separately say three things:

  1. There are fewer broadband providers where the terrain is steeper
  2. More broadband providers increase the use of broadband internet
  3. People with broadband access consume a lot more partisan media especially from sources congenial to their partisanship

Considering these three claims, it can be inferred that the places with less steep terrain have more polarization. Can we claim that? San Francisco, Seattle, and Pittsburgh are considered the hilliest places in the US. Does that mean that people in New York are more polarized than the people in these three places? Also, do more people in New York City have access to broadband than the people in Seattle?

Also, people with more money will have access to the better internet. Therefore, it can also be interred that rich people are more liable to polarize than the poor. Whereas, it is not generally true (I assume). Education is directly proportional to income in most cases and hence more educated will have access to the better internet because they can afford it. I can indirectly infer that education results in polarization just because educated people can afford better internet. Now, this claim seems funny, and hence I think their study too. I think that the assumption that “anyone who visits the left-leaning websites is left-leaning” is not the correct way to go about this study.
Read More

Reflection #12 – [04/05] – [Hamza Manzoor]

[1] Nguyen, Thin, et al. “Using linguistic and topic analysis to classify sub-groups of online depression communities.” Multimedia tools and applications 76.8 (2017): 10653-10676.

In this paper, Nguyen et al. use linguistic features to classify sub-groups of online depression communities. The dataset that they use is of Live Journal and is comprised of 24 communities and 38,401 posts. These communities were grouped into 5 subgroups: bipolar, depression, self-harm, grief, and suicide. The authors built 4 different classifiers and Lasso performed the best. First of all, the size of the dataset is very small and secondly, I don’t mind the use of Live Journal but most of the papers that were similar to this topic performed their studies on multiple platforms because it is possible that they got their results due to the certain specific characteristics of Live Journal platform.

I am pretty sure that this paper was a class project given the size of data the way they performed modeling. First, the authors labeled the data themselves that can induce some bias and secondly, the major put off was that they used 4 different classifiers instead of using multi-class classifier. I wish they had a continuous variable 😉

Finally, my biggest criticism is that why the 5 subgroups were created because self-harm, grief, suicide etc. are a result/cause of depression and therefore, the claim in the paper that “no unique identifiers were found for the depression community” verifies my argument. The subgroups, which are the basis of entire paper do not make sense to me at all.

[2] Felbo, Bjarke, et al. “Using millions of emoji occurrences to learn any-domain representations for detecting sentiment, emotion, and sarcasm.” arXiv preprint arXiv:1708.00524 (2017).

In this paper, Felbo et al. build an emoji predictor named DeepMoji. The authors build a supervised learning model on an extremely large dataset of 1.2 billion tweets to classify the emotional sentiment conveyed in tweets with embedded emoji. The experiments showed that DeepMoji outperformed state of the art techniques for the specific dataset.

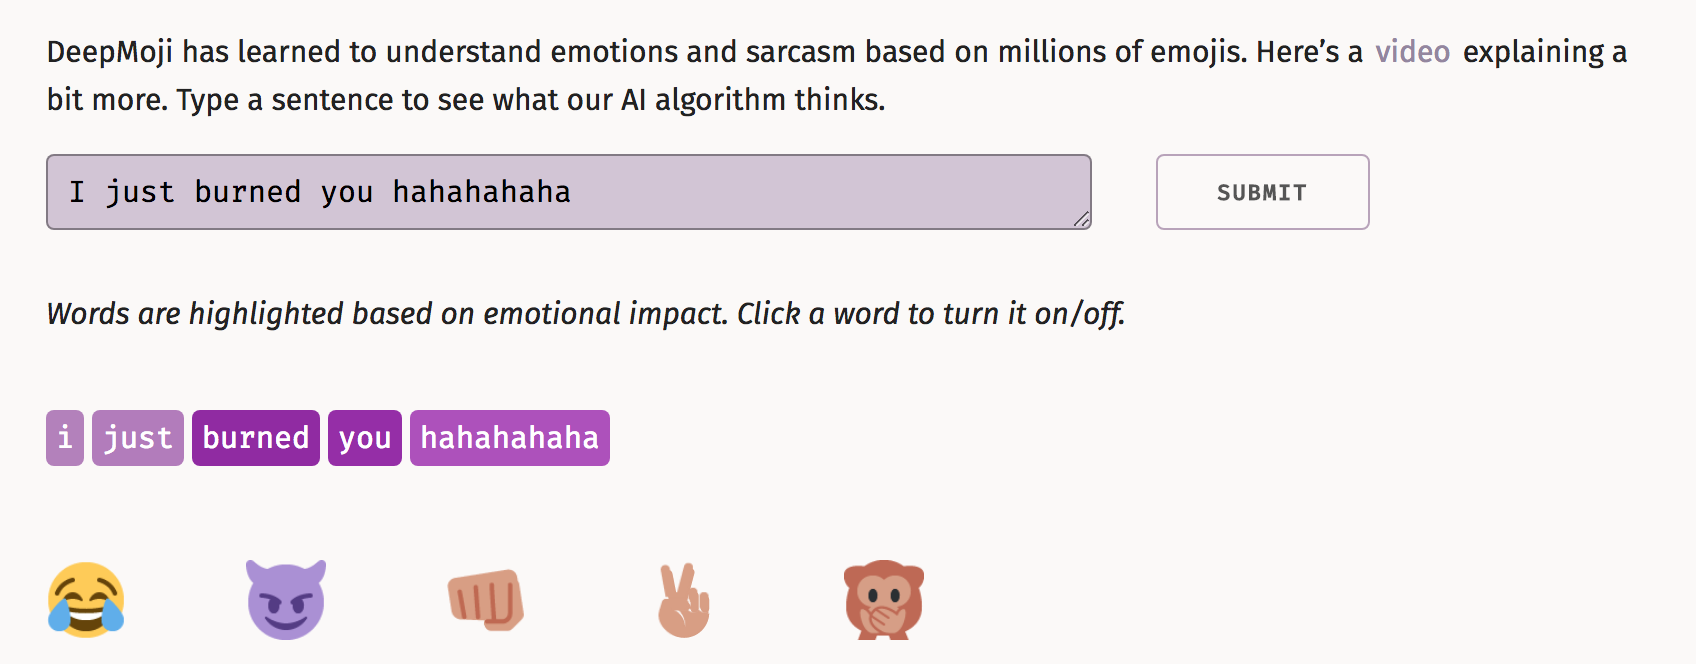
My first reaction after looking at the size of the dataset was “Woah!! They must have supercomputers”. I wonder how long did it take for their model to train. The thing that I liked the most about this paper was that they provided a link to a working demo (https://deepmoji.mit.edu). Given that I had a hard time understanding the paper, I spent a lot of time playing around with their website and I can’t help but appreciate how accurate their model is. Here is one example that I tried for a phrase “I just burned you hahahahaha”, and it showed me the most accurate associated emojis.

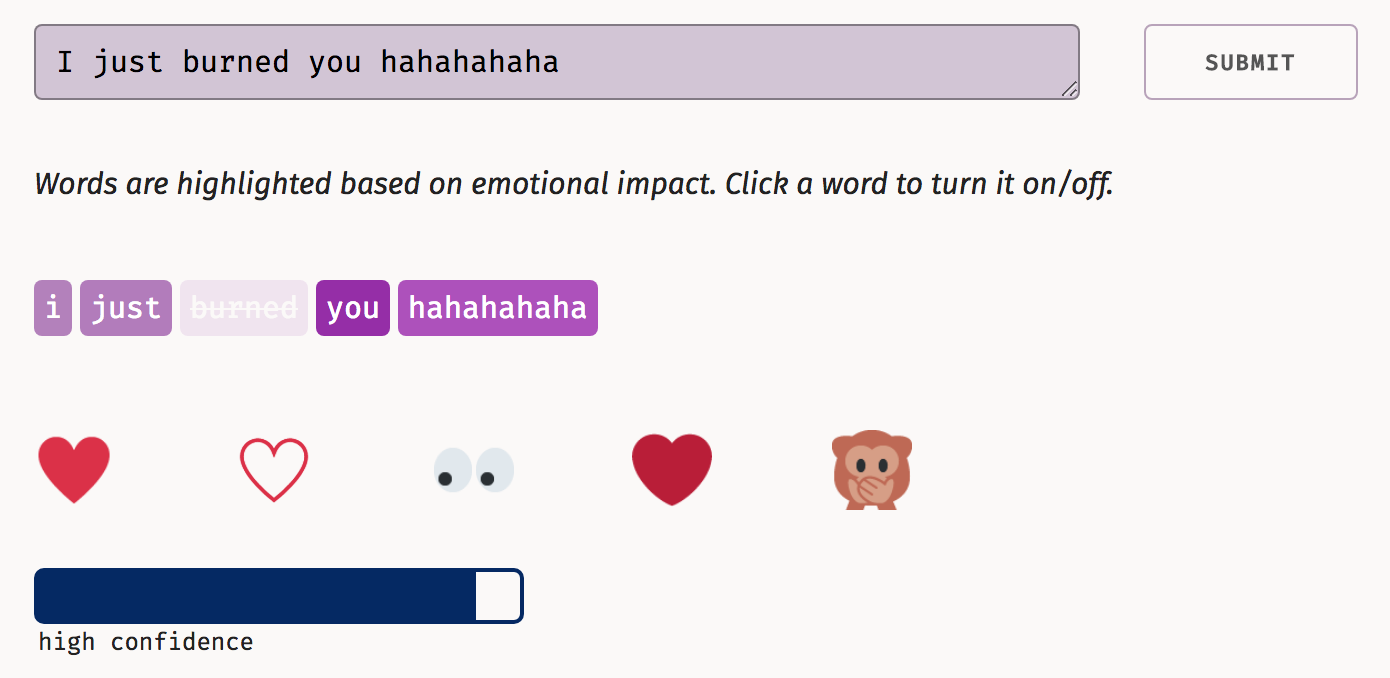
Now, when I removed the word ‘burned’, it showed me the following


Due to my limited knowledge of deep-learning, I cannot say if there were flaws in their modeling or not, but it seemed pretty robust and the results of their tool show that robustness.

Anyway, I believe that this paper was very Machine Learning centric and had less to do with psychology.

Finally, the authors say in the video (https://youtu.be/u_JwYxtjzUs) that this can be used to detect racism and bullying. I would like to know how the emojis can help in that?

Read More

Reflection #11 – [03/27] – [Hamza Manzoor]

[1] King, Gary, Jennifer Pan, and Margaret E. Roberts. “Reverse-engineering censorship in China: Randomized experimentation and participant observation.” Science 345.6199 (2014): 1251722.

[2] Hiruncharoenvate, Chaya, Zhiyuan Lin, and Eric Gilbert. “Algorithmically Bypassing Censorship on Sina Weibo with Nondeterministic Homophone Substitutions.” ICWSM. 2015.

Summaries:

In the first paper, King et al. conducted an experiment on censorship in China by creating their own social media websites. They submitted different posts on their social media websites and observed how these were reviewed. The goal of their study was to reverse engineer the censorship process. The results of their study show that the posts that invoke collective actions like protests are censored, whereas, the posts containing criticism of the state and its leaders are published.

In the second paper, Hiruncharoenvate et al. performed experiments to manipulate the keyword based censoring algorithms. They make use of homophones of censored words to get past automated reviews. The authors collected the censored Weibos and developed an algorithm that generates homophones for the censored keywords. The results of their experiments show that that posts with homophones tend to stay 3 times longer and that the native Chinese speakers do not face any trouble deciphering the homophones.

Reflections:

Both these papers use deception to manipulate the “The Great Firewall of China”. The first paper felt like a plot of a movie, where a secret agent invades another country to “rescue” its citizens from a so-called tyrant oppressor. According to me, the research conducted in both of these papers are ethically wrong on so many levels. There is a fine line between illegal and unethical and I think that these papers might have crossed that line. Creating a secret network and providing ways to manipulate the infrastructure created by a government for only its own people is wrong in my opinion. How is it different from the Russian hackers using Facebook to manipulate the election results? Except for the fact that these research papers are in the name of “Free Speech” or “Research”. Had Russians written a research paper “Large-scale experiment on how social media can be used to change users opinions or manipulate elections”, would that justify what they did? NO.

Moving further, one question that I had while reading the first paper was, if they already had access to the software, then, why did they create a social network to see which posts are blocked when the same software was used to block the posts in those social networks in the first place? Or did I understand it wrongly? Secondly, being unfamiliar with the Chinese language, the use homophones in second paper is interesting, and since we have both Chinese speakers presenting tomorrow, it would be nice to know if all the words in Chinese have homophones. Also, is it only in Mandarin or in all Chinese languages? I believe we cannot replicate this research in any other popular language like English or Spanish.

Furthermore, in the second paper, the main idea behind the use of homophones is to deceive the algorithms. The authors claim that the algorithms get deceived due to a different word but the native speakers were able to get the true meaning by looking at the context of the sentence. This makes me wonder that with the new deep learning techniques it is possible to know the context of a sentence and therefore, will this research still work? Secondly, after some time the Chinese government will know that people are using homophones and therefore, feeding homophones to algorithms should not be too difficult.

Finally, it was interesting to see in the first paper that the posts that invoke collective actions like protests are censored, whereas, the posts containing criticism of the state and its leaders are published. So, essentially, the Chinese government is not against criticism but protests. Now, the question of ethics for the other side, is it ethical for governments to block posts? And, how is what the Chinese government doing is different from when other governments crack down on their protestors? Allowing protests and then cracking down on them seems even worse than disallowing protests at all.

Read More

Reflection #10 – [03/22] – [Hamza Manzoor]

[1]. Kumar, Srijan, et al. “An army of me: Sockpuppets in online discussion communities.” Proceedings of the 26th International Conference on World Wide Web. International World Wide Web Conferences Steering Committee, 2017.

Summary:

In this paper, Kumar et al. present a study on sockpuppets in online discussion communities. They perform their study on nine different online discussion communities and their data consisted of around 2.9 million users. Authors use multiple logins from the same IP to identify sockpuppets and evaluate the posting behavior and linguistic features of sockpuppets to build a classifier. The authors find that the ordinary users and sockpuppets use different languages and sockpuppets tend to write more posts than ordinary users (699 vs. 19). Sockpuppets also use more first person and second person singular personal pronouns and are more likely to be down-voted, reported, or deleted. The authors also explain the types of sockpuppets as “pretenders and non-pretenders” and “supporters vs. dissenters”.

Reflection:

I really enjoyed reading this paper because the study they performed was very different especially the labels creation using IP addresses and user sessions. The authors received non-anonymized data from Disqus, which makes me question that is it legal for Disqus to share non-anonymized data?

Some of the findings in the study were very astonishing such as email addresses and usernames of sockpuppets are more similar. First, I do not like the approach to classify sockpuppets based on username and second, I am having hard time believing that sockpuppets have similar usernames and emails. Do they mean that all usernames and emails of one puppet master similar to one another? Or are they similar to other sockpuppets?  

Their findings also show that 30% of sockpuppets are non-supporters, 60% are supporters and only 10% are dissenters. It would have been interesting find that sockpuppets support each other on what kind of topics? Do we see more supporters on political topics? Or are there sockpuppets belonging to one puppet master which are supporters on one left leaning topics and dissenters on right leaning topics and vice versa? If yes, can we claim that does some specific party pay someone to create these sockpuppets?

Read More

Reflection #9 – [02/22] – [Hamza Manzoor]

[1]. MITRA, T.; COUNTS, S.; PENNEBAKER, J.. Understanding Anti-Vaccination Attitudes in Social Media. International AAAI Conference on Web and Social Media, North America, mar. 2016.

[2]. Choudhury, M.D., Counts, S., Gamon, M., & Horvitz, E. (2013). Predicting Depression via Social Media. ICWSM.

Summaries:

In [1] Mitra et al. tried to figure out the anti-vaccination attitudes in social media. The authors tried to understand the attitudes of participants involved in the vaccination debate on Twitter. They used five phrases related to vaccines to gather data from January 01, 2012 to June 30, 2015, totaling to 315,240 tweets generated by 144,817 unique users. After filtering, the final dataset had 49,354 tweets by 32,282 unique users. These users were classified into three groups: pro-vaccine, anti-vaccine and joining-anti (those who convert to anti-vaccination). The authors found that the long-term anti-vaccination supporters have conspiratorial views and are firm in their beliefs. Also, the “joining-anti” share similar conspiracy thinking but they tend to be less assured and more social in nature.

In [2] Choudhury et al. predict depression via social media. The authors use crowdsourcing to compile a set of Twitter users who report being diagnosed with clinical depression, based on a standard psychometric instrument. The total of 1,583 crowd-workers completed the human intelligence tasks and only 637 participants provided the access to their Twitter feeds. After filtering, the final dataset had 476 users who self-reported to have been diagnosed with depression in the given time range. They measured the behavioral attributes relating to social engagement, emotion, language and linguistic styles, ego network, and mentions of antidepressant medications of these 476 users over a year preceding the onset of depression. They built a statistical classifier that provides estimates of the risk of depression before the reported onset with an average accuracy of ~70%. The authors found that the individuals with depression show lowered social activity, greater negative emotion and much greater medicinal concerns and religious thoughts.

Reflections:

Both the papers are very socially relevant and I really enjoyed both readings. The first paper says that the long-term anti-vaccination supporters are very firm in their conspiracy views and we need new tactics to counter the damaging consequences of anti-vaccination beliefs but I think that the paper missed a very key analysis of fourth class of people “joining-pro”. Analyzing the fourth class might have provided some key insights into “tactics” to counter anti-vaccination beliefs. I also have major concerns regarding the data preparation. Even though MMR is related to vaccines but autism has more to do with genes because autism tends to run in families which makes me question that why did 3 out of 5 phrases had autism is it? Secondly, the initial dataset to identify pro and anti stance contained 315,240 tweets generated by 144,817 individuals and the final dataset had 49,354 tweets by 32,282 unique users. This means that each user on average had 1.5 tweets relating to vaccines in almost 3.5 years. Is this data enough to classify the users as pro-vaccination or anti-vaccination? Because millions of tweets of these same users are analyzed in the analysis.

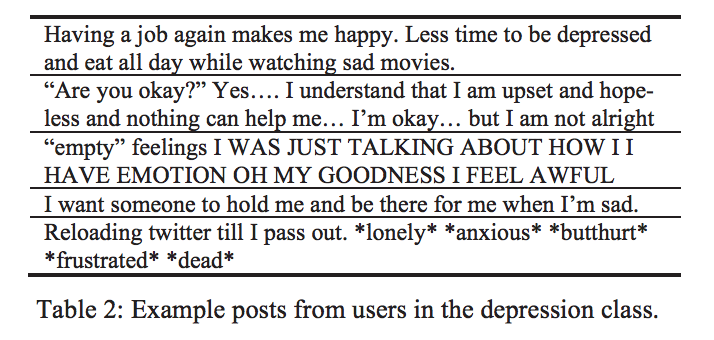
The second paper was also an excellent read and even though 70% accuracy might not be the most desirable results in this case but I really liked the way entire analysis was conducted. The authors mined 10% sample of a snapshot of the “Mental Health” category of Yahoo! Answers. One thing that I would like to know is that is mining websites ethical? Because scraping often violates the terms of service of the target website and secondly, publishing scraped content may be a breach of copyright. I also have a doubt that how can all “randomly” selected 5 posts in Table 2 out of 2.1 million tweets be all exactly related to depression. Was this at all really random?

I also feel that the third post has more to do with sarcasm than depression. Which makes me wonder why sarcasm was not catered for in the analysis?

Furthermore, just like the first paper, I have concerns with the data collection for this paper as well. They had put me off when they said that they paid 90 cents for completing the tasks. Is everyone really going to fill anything with complete honesty for 90 cents? Secondly, 476 out of final 554 users self-reported to have been diagnosed with depression, which is ~86% of users where as, the depression rate is US is ~16%. Which makes me question again that did they fill the survey honestly, especially if you are paying them 90 cents? Other than that, the authors did a terribly good job in analysis especially the features that they created. They covered all grounds from number of inlinks to linguistic styles to even the use of antidepressants. I believe that except for the data part, the analysis of both papers were thorough done and are excellent examples of good experimental designs.


Read More

Reflection #8 – [02/20] – [Hamza Manzoor]

[1]. Bond, Robert M., et al. “A 61-million-person experiment in social influence and political mobilization.” Nature 489.7415 (2012): 295.

[2]. Kramer, Adam DI, Jamie E. Guillory, and Jeffrey T. Hancock. “Experimental evidence of massive-scale emotional contagion through social networks.” Proceedings of the National Academy of Sciences 111.24 (2014): 8788-8790.

Summaries:

Both these papers come from researchers at Facebook and focus on influence of social networking platforms. In [1] Bond et al. run a large-scale experiment and show that how social media can encourage users to vote. They show that the social messages not only influence the users who receive them but also the users’ friends, and friends of friends. They perform a randomized controlled trial of political mobilization messages on 61 million Facebook users during the 2010 U.S. congressional elections. They randomly assigned users to a ‘social message’ group (~60M), an ‘informational message’ group (~600k), or a control group (~600k). The ‘social message’ group was shown a button “I Voted” and a counter indicating how many other Facebook users had previously reported voting including pictures of 6 of their friends. The ‘informational message’ was only shown “I Voted” button and control group was not shown anything. The authors discovered that ‘social message’ group was more likely to click on the “I Voted” button. They also matched the user profiles with public voting records and observed that the users who received the social message were more likely to vote than other two groups. They also measure the effect of friendships and found that likelihood of voting increases if a close friend has voted.

In [2] Kramer et al. analyzed if the emotional states spread through social networks. They present a study that shows that emotional states can be transferred to others via emotional contagion. The experiment manipulated the extent to which people (N = 689,003) were exposed to emotional expressions in their News Feed. They conducted two parallel experiments for positive and negative emotion and tested whether exposure to emotions led people to change their own posting behaviors, in particular whether exposure to emotional content led people to post content that was consistent with the exposure. The results of their experiment show that emotions spread via contagion through a network and the emotions expressed by friends, via online social networks, influence our own moods. In short, they found that when negativity was reduced, users posted more positive content, and vice versa.

Reflections:

Keeping aside the ethical implications, which we have already discussed in class regarding the first paper, I believe they were very well designed experiments which makes me wonder that is there a way we can get Facebook data for analysis?

While reading the first paper, the thought that I had in mind was that people must have clicked on “I Voted” just for the sake of being socially relevant but I was glad that authors validated their findings with public voting records.

Even though I really liked the experimental design but I still have major concerns regarding the imbalance in sample size, 60 million to 600k. Also, was that 600k sample diverse enough? I wasn’t also convinced with their definition of close friends that “Higher levels of interaction indicate that friends are more likely to be physically proximate”. How can they claim this without any analysis? It is highly possible that I interact with someone just because I like his posts but I haven’t met him in real life. Furthermore, there can be many external factors that make a user go for voting but in general I would agree with the results of the findings and even though we cannot say for sure that these messages were the reason people went for voting but people generally want to be socially relevant. It would have been interesting to see if conservatives or liberals were more influenced by these messages but I believe that there is no way to validate it. But one potential research direction can be to characterize people on different traits and analyze if certain types of people are more easily influenced than others.

In the second paper, the authors show that users posted more positive content when negativity was reduced. This finding is completely in conflict with many other studies that show that social media causes depression and seeing other people happy makes other people feel their life is “worthless” or not very happening. Secondly, Facebook posts are generally much longer than tweets and characterizing them as positive or negative if they contained at least one positive or negative word respectively is naïve, the entire sentiment of posts should have been analyzed which Googles’ API does very efficiently (might not be available in 2014). Apart from all these concerns, I thoroughly enjoyed reading both papers.

Read More

Reflection #7 – [02/13] – [Hamza Manzoor]

[1]. Niculae, V., Kumar, S., Boyd-Graber, J., & Danescu-Niculescu-Mizil, C. (2015). Linguistic harbingers of betrayal: A case study on an online strategy game. arXiv preprint arXiv:1506.04744.

This research paper explores linguistic cues in a strategy game ‘Diplomacy’ to examine patterns that foretell betrayals. In Diplomacy each player chooses a country and tries to win the game by capturing other countries. Players form alliances and break those alliances, sometimes through betrayal. The authors have tried to predict a possible betrayal based on sentiment, politeness, and linguistic cues in the conversation between players. The authors collected data from 2 online platforms that comprised of 145k messages from 249 games. The authors predict betrayal with 57% accuracy and find a few interesting things such as: betrayer has more positive sentiment before betrayal, less planning markers in betrayer’s language and have more polite behavior.

I thoroughly enjoyed reading this paper………. until section 4, where they explain modeling. I felt that either modeling process was poorly performed or otherwise should have been explained better. All they say is that “expert humans performed poorly on this task”, but what did those experts do? What does poorly mean? After that, they built a logistic model after univariate feature selection and best model achieves a cross-validation accuracy of 57% and F1 score of 0.31. What is the best model? They did not explain their “best model” and what features went into it. Secondly, is 57% accuracy good enough? A simple coin toss would have given us 50%. They also had various findings on eventual betrayer such as: he is more polite before betrayal etc. but what about the cases when betrayal does not happen? I felt that they only explained statistics for cases with betrayals.

Finally, can we generalize the results of this research? I can claim with 100% certainty that everyone will say “NO” because human relations are much more complex than simple messages of attack or defense. I appreciate the fact that authors have addressed that they do not expect the detection of betrayal to be solvable with high accuracy. But supposing 57% significant enough, can we generalize it to real-world scenarios that are similar to Diplomacy? For example: a betrayal from your office colleague working on a same project as you but taking all the credit to gain promotion. Can we detect that kind of betrayal from linguistic cues? Can we replicate this research on similar real-life scenarios?

Read More

Reflection #6 – [02/08] – Hamza Manzoor

[1]. Danescu-Niculescu-Mizil, C., Sudhof, M., Jurafsky, D., Leskovec, J., & Potts, C. (2013) “A computational approach to politeness with application to social factors”.

[2]. Voigt, R., Camp, N. P., Prabhakaran, V., Hamilton, W. L., Hetey, R. C., Griffiths, C. M., … & Eberhardt, J. L. (2017) “Language from police body camera footage shows racial disparities in officer respect”.


The Danescu et al. paper proposes a framework for identifying linguistic aspects of politeness in requests. They analyze requests in two online communities: Stack Exchange and Wikipedia on exploring the content politeness on social platforms like Wikipedia, Stack Exchange. They annotated over 10,000 utterances from over 400,000 requests using Amazon Mechanical Turk. Using this corpus of over 10,000 utterances, they conducted a linguistic analysis by constructing a politeness classifier. Their study shows that politeness and power are negatively correlated, that is, the politeness level decreases with increase in power. They also show the relationship between politeness and gender.

In second paper, Voigt et al. investigate that the language from police body camera footage shows racial disparities in officer respect. They analyzed footages from police body-worn cameras, and conducted three studies to identify how respectful police officers are towards white and black community members by applying computational linguistic methods on transcripts. Their results show that police officers show less respect toward black versus white community members, even after controlling various factors such as race of the officer or location of stop.

I particularly liked how they prepared data in both papers especially in second. In first paper, they tried to mitigate the affects of subjectivity of politeness and explained how people are more polite before becoming admins. But does it matter? I am not sure about Wikipedia but on Stack Exchange, the elections are majorly independent of their past. I vote people by just reading at their story and plans for community and I never go to their profile and look at each of their questions that how polite were they. Therefore, can we claim that people show politeness to gain power? I don’t think so. Secondly, we know that politeness and power have inverse relationships in real world as well. Therefore, can we generalize this? Can we claim that online communities are similar to real world communities? Because repercussions of being impolite are very different in both.

The second paper has very thorough analysis and there is hardly anything wrong with the study they performed. It was really interesting to see that how formality decreases with increase in time in general but in a higher crime rate formality increases. In the first study, they randomly sampled 414 unique officer utterances and asked participants to rate it. Is out of context utterance from middle of conversation a true predictor of politeness? Also, I believe that using Oakland for study without explaining black vs. white crime rates in Oakland is somewhat naïve approach. It might be possible that crime rate by black community members in the Oakland is higher and hence as a result police officers are less polite towards them. Also, the paper explains that there is no correlation of politeness with race of police officer. Does this mean that even a black officer is less polite towards black community member? If so, then crime rate must be looked at. Otherwise, the analysis and modeling in paper was very well presented.

Read More

Reflection #5 – [02/06] – Hamza Manzoor

[1]. Garrett, R. Kelly. “Echo chambers online?: Politically motivated selective exposure among Internet news users.” Journal of Computer-Mediated Communication2 (2009): 265-285.

[2]. Bakshy, Eytan, Solomon Messing, and Lada A. Adamic. “Exposure to ideologically diverse news and opinion on Facebook.” Science6239 (2015): 1130-1132.

The theme of both these papers is online echo chambers that people read news or information, which favor their opinions ignoring the views of the opposing ideology. The Garrett et al. conducted a study with users recruited from two news websites, AlterNet (left-leaning) and WorldNetDaily (right-leaning). Their study was a web administered behavioral study in which participants selected articles to read in 15 minutes. The findings of the study supported the author’s hypotheses that users are more likely to view opinion-reinforcing information and will spend more time on opinion-reinforcing information.

On the other hand, Bakshy et al. performed analysis on around 10.1 million active users of Facebook who self-report their political affiliations. They examined how users interact with shared news articles by their friends as well as by algorithmically ranked news feed. Their findings were that compared with algorithmic ranking, individuals’ choices play a strong role in limiting exposure to cross-cutting content.

The Garrett et al. study was very thorough and the paper was very well written. The hypotheses were clear and the results presented backed up those hypothesis. But they assumed that everyone who visited AlterNet was left-leaning and WorldNetDaily visitors were right-leaning without any evidence to support this claim. Secondly, this sample does not ensure that it is representative of the population. Also, the length of news article should have been mentioned because the read time per story ranged from 4 seconds to 122 seconds. How can it be 4 seconds? Also, can we make a claim about read time from such study? It is highly likely that general reading patterns of people can be vastly different than the ones under study because they know that they are under experiment. It will be interesting to compare the results with people who aren’t aware that they are under study. Finally, the study is focused on three issues (gay marriage, social security reform, and civil liberties), which can have political affiliation, but will this study hold true for sports or other benign issues?

The Bakshy et al. study was interesting but had a huge limitation that it recorded engagements based on clicks. They mention that users might be reading the displayed summaries but not clicking it. This limitation makes me question the results for a reason that just because user is not clicking on opinion-challenging information does not mean that it will create an echo chamber. It is possible that user is aware of the other side of story but it is only natural that people read more of what they like and hence clicking on opinion-reinforcing information. I also felt that study on neutral people should have been more thorough and one out of context research idea that popped in my mind while reading the paper was that it will be interesting to see how ranking algorithms perform in case of neutral people? Do ranking algorithms play a role in creating echo chambers? It is highly likely that a neutral person has majority of left (or right) leaning friends and therefore, will encounter respective information and as a result ranking algorithm might confuse him with left (or right) leaning person. This seems like an interesting research direction to me.

Read More

Reflection #4 – [1/30] – Hamza Manzoor

[1]. Garrett, R. Kelly, and Brian E. Weeks. “The promise and peril of real-time corrections to political misperceptions.”

[2]. Mitra, Tanushree, Graham P. Wright, and Eric Gilbert. “A parsimonious language model of social media credibility across disparate events.”


These papers are very relevant in this digital age where everyone has a voice and as a result there is plethora of misinformation around the web. In [1], the authors compare the effects of real-time corrections to corrections that are presented after a distraction. To study the implications of correcting the incorrect information, they conducted a between-participants experiment on electronic health records (EHRs) to examine how effective is real-time corrections to corrections that are presented later. Their experiment consisted of demographically diverse sample of 574 participants. In [2], Mitra et. al. present a study to assess the credibility of social media events. In this paper, they present a model that captures language used in Twitter messages of 1,377 real-world events (66M messages) using CREDBANK corpus. The CREDBANK corpus used Mechanical Turks to obtain credibility annotations, after that the authors trained penalized logistic regression using 15 linguistic and other control features present to predict the credibility level (Low, Medium or High) of the event streams.

Garrett et. al. claim that real-time correction even though is more effective than delayed correction but it can have implications especially with people who are predisposed to a certain ideology. First of all, the sample that they had was US-based, which makes me question that will these results hold in other societies? Is sample diverse enough to generalize it? Can we even generalize it for US only? The sample has 86% white people whereas, US has over 14% non-resident immigrants only.

The experiment also does not explain what factors contribute towards people sticking to their preconceived notions? Is it education or age? Are educated people more open to corrections? Are older people less likely to change their opinions?

Also, one experiment on EHRs is inconclusive. Can one topic generalize the results? Can we repeat these experiments with more controversial topics using Mechanical Turks?  

Finally, throughout the paper I felt that delayed correction was not thoroughly discussed. I felt that paper focused so much on psychological aspects of preconceived notions that they neglected (or forgot) to discuss delayed correction. How much delay is suitable? How and when should delayed correction be shown? What if reader closes the article right after reading it? These are the few key questions that should have been answered regarding delayed corrections.

In second paper, Mitra et. al. presented a study to assess the credibility of social media events. They use penalized logistic regression, which in my opinion was a correct choice because linguistic features would add multi co-linearity and penalizing features seems to be the correct approach. But since they use CREDBANK corpus, which used Mechanical Turks, it raises the same questions we discuss in every lecture that did Turkers thoroughly went through every tweet? Can we neglect Turkers bias? Secondly, can we generalize that Pca based credibility classification technique will always better than data-driven classification approaches?

The creation of features though raises few questions. The authors make a lot of assumption in linguistic features for example, they hypothesize that coherent narrative can be associated with higher level of credibility which even though does make sense but can we hypothesize something and not prove it later? Which makes me questions on feature space that were they right features? Finally, can we extend this study to other social media? Will a corpus generated through twitter events work for other social medias?


Read More