Reflection #13 – [11/29] – [Eslam Hussein]

David Lazer and Jason Radford, “Data ex Machina: Introduction to Big Data”

Summary:

The  authors in this paper focused on explaining big data for the sociology community and the opportunities they offer to them. They classify big data into three categories based on how social data digitized which are digital life, digital traces and digitalized life. They also explain related problems and issues such as 1) Generalizability, when researchers conclude generalized findings without paying attention to how the data is collected and that each platform has its own census and definitions of social phenomenon such as friendship. 2) Too many Big Data, where the data needed to study a social behavior exist in different platforms that studying a dataset from one of them is not sufficient. 3) Artifacts and Reactivity, where Big data is not to be trusted for the various anomalies and errors due to technical changes. 4) Assuming the human/user being studied true actual and authentic user “they call them ideal users”, while in the digital world this not true due to false users “bots and puppets” and the user data being manipulated.

Reflection:

  • I like the suggestion proposed by the authors to solve the generalization issue by combining data from different sources. That makes me think about studying phenomenon on different social platforms and how close and relate they do to each other, for example, studying anti-social behaviors on different social platforms, do users behave similarly? do they use the same language or each platform has its own? if we studied bot/puppets on different systems, do they have similar characteristics so that we can generalize their models to other systems. I think those are interesting studies to conduct.
  • The authors assumed that big data gathered from digital social world will represent and facilitate the studies of social phenomenon. This might be true for some phenomenon but untrue for others since people do not behave the same in both worlds. Digital/virtual worlds protect their residents from many consequences that might happen in the real world where people are more conservative, discrete and insecure. Also those virtual worlds promote new behaviors and create new phenomenons that would not exist in the real social life such as anonymity, bots and puppetsThat is why big data offer more opportunities and challenges to social scientists than those data gathered from real world using conventional methods such as field studies and surveys.
  • Another issue came into my mind when studying big data for social purposes is what is the best data format to represent social data? is it in the traditional tabular format (spreadsheets and relational databases), or as graphs (graph databases and format used by social network analysis tools) or in raw format files (images, text, video)? I think how we represent our data would definitely help and facilitate lots of tasks in our studies.


Read More

Reflection #12 – [10/23] – [Eslam Hussein]

1)- Robert M. Bond, Christopher J. Fariss, Jason J. Jones, Adam D. I. Kramer, Cameron Marlow, Jaime E. Settle and James H. Fowler, “A 61-million-person experiment in social influence and political mobilization”

2)- Adam D. I. Kramer, Jamie E. Guillory, and Jeffrey T. Hancock, “Experimental evidence of massive-scale emotional contagion through social networks”

Summary:

Both papers examine social influence in online social networks (which is Facebook in both). The first paper studies if political behavior is contagious and can spread through an online social network, as it measures a social message on Facebook can influence users to vote during the US congressional election vs an informational message. They also measure the influence of friendship on Facebook in encouraging users to participate in the voting process. The second paper studies the emotional contagion on Facebook users and can controlling the percentage of emotional news and activities in the news feed could affect the Facebook user. Also both papers verify that the effects of face-to-face or non-verbal communications to propagate emotions and ideas are similar to those verbal/textual communication on social networks.


Reflection:

  • In the first paper the authors divided their test groups into unbalanced three groups: the social message group (n = 60,055,176), the informational message group (n = 611,044) and the control group (n = 613,096). I do not know why they dedicated most of their test subjects to the first group (they did not give an explanation for that)
  • The experiment in the second paper made me think that I have to read carefully the terms of use and privacy conditions of whatever social media I sign up to. Clearly the experiment is legal but is it ethical? Should Facebook experiment people and manipulate their emotions. I wounder what else they are testing?
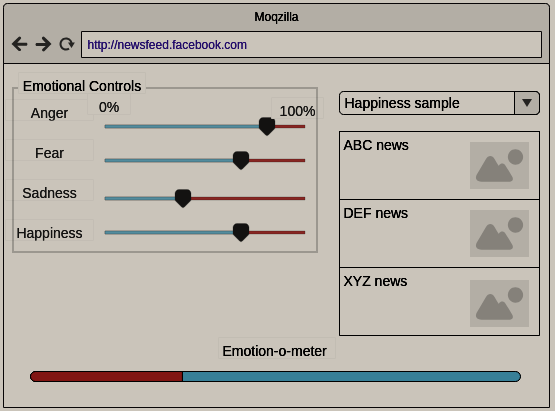
  • Facebook news feed proved to be a powerful tool that can affect one’s emotions, mood and beliefs. I would like as a Facebook user some control over my news feed with respect to the type of emotions that the news hold. I would like to filter in/out posts and news related to my preferred mood. If this tool can classify the current post/activity into emotional/mood statuses and then later give the user the ability to control what to be displayed based on his/her target mood(s). This tool could also include an emotion-o-meter of the current news feed whether it is positive or negative or just normal news. This tool could help users maintain their well-being and mental health and measure how toxic their news feed is.

  • In the second paper, the authors collected data for one week (January 11–18, 2012). I wonder if it was better if they collected data in some other period, since that time of the year is right after Christmas where people have recent positive emotions which might affect their online behavior and reaction to their news feeds.
  • The second paper gave me an idea about enhancing the text-based sentiment analysis classifiers after adding emojis as features into the classification models

Read More

Reflection #11 – [10/16] – [Eslam Hussein]

Cristian Danescu-Niculescu-Mizil, Moritz Sudhof, Dan Jurafsky,
Jure Leskovec, and Christopher Potts, “A computational approach to politeness with application to social factors”

Summary:

The authors in this papers introduced a computational framework for detecting and describing politeness. The built a politeness corpus from annotating request (which embed politeness) from two platforms (Wikipedia and Stack exchange). Then they trained a couple of classifiers based on that corpus (The Wikipedia requests) and tested them using the Stack Exchange annotated request. The classifiers achieved near-human accuracy. Finally, they classify the rest of the requests using those models and discuss the findings from the classified data and the social theory between social outcomes, power and politeness.

Reflection:

  • I appreciate all the statistical analysis and validation the authors did in this work. I think this paper gives a lot of statistical guidance to those who need to perform similar linguistic analysis of similar problems
  • I wish the real world follow this theories were being polite is appreciated and awarded
  • I also suggest if the authors would study the correlation in Stack Exchange between the politeness of the questions being asked and the number of answers/responds they receive. I believe we would find a strong positive correlation between those two
  • Although the authors did hard work gathering and annotating and analyzing this data/requests but I think there is a big shortcoming in their work which is the number of annotated request. The number of annotated requests is about 11,000 request out of the whole gathered 409,000 requests which is about only 2.7%. They used 2.7% of the data to train and test their models then used those models to classify the rest (about 97.3%) which has been used in their analysis. Despite that they mentioned in the Human Validation paragraph that they turned to human annotation to validate their methodology but they did not mention how many requests has been validated. I am skeptical about the amount of annotated data and I think they should increase the annotated requests set into a reasonable percentage and then redo their analysis
  • I do not find table 8 useful in this paper as I can not find any association between the programming languages and the politeness. I wish the authors gave more explanation about that table
  • I admire how the authors employed the politeness theory in order to explain the findings of their analysis. I believe readings and courses in Sociology and Psychology are crucial for the Social Computing course otherwise it would be just data analytics without any social insights

Read More

Reflection #10 – [10/02] [Eslam Hussein]

Paper: Kate Starbird, “Examining the Alternative Media Ecosystem through the Production of Alternative Narratives of Mass Shooting Events on Twitter”

Summary:

The author(s) in this paper did a very deep analysis of the alternative media ecosystem through data collected from twitter about shooting events during 2016. He performed both quantitative and qualitative analysis and included different dimensions (such as political leaning, narrative stance, account types … etc) to facilitate better understanding the data and findings.

Reflection:

  • I would like to do a similar analysis of voting events such as the Brexit and the US 2016 presidential election. I believe the findings about the political leaning would be similar (anti-globalist alternative media promoting the Brexit and Trump election)
  • I would prefer if the author did also a similar analysis but for each event in separate and compare the similarity between them. Since the data represent events scattered temporally and geologically
  • The findings in the paper regarding how the U.S. Alt right media always accused mainstream media of making fake news and they introduce themselves as anti-globalists. Those findings remind me about how often Trump used to call mainstream media as “fake news” in his tweets (more than 500 times) and he declared his statement in the UN as anti-globalist. Those anti-globalist movements in the media inspire me to do more analysis about how social media played a significant role promoting the rise of the right anti-globalists in the western world (specially during the political elections in Europe in the past few years)
  • I think it would have helped the author in his analysis if he employed some community structure analysis on the graph in order to abstract and summarize it
  • The author mentioned that he is left-leaning and the findings in figure 3 showed that the right-leaning alt medias are the most dominating source of conspiracy news., specially that the analysis relied on lots of qualitative work. I do not know if the results are biased or not but that raises questions about those finding and might require more analysis to verify that. Also it made me wonder how an author could control his preferences (political, religious, sexual … etc) while conducting a qualitative study that requires the author’s own interventions and selections?
  • How could we teach people about the leaning of such media? Mainstream media which are easier to classify their bias due to their source of funding and connections which might be clear to the ordinary user. While on the other hand non-mainstream media are harder track and verify their agenda. I think if have some website/database of such media that is updated regularly would help to track them and classify their leaning and understand the message they are spreading.

Read More

Reflection #9 – [09/27] – [Eslam Hussein]

The talk given by Talia Stroud, inspired me to design a tool that will facilitate a longitudinal study. The tool briefly is a political news aggregator website (I will explain it later in more details). The study aims to measure and monitor the reading habits of the site’s users, and try to measure techniques that try to expose users to news articles that opposes their political preferences and if those techniques could affect their reading habits and political preference. This tools could help in mitigating the level of polarization between the community of online news readers.

The site will allow users to build their profiles and personalize their news feed. That is by providing details about their social identity, political preferences, and their opinions/preferences regarding a set of the most common controversial topics that being actively discussed and would affect their political/voting preferences (such as, gay marriage, abortion, immigration, Animal Testing, Gun Control … etc).

The site would also give each user a profile color that ranges from red and blue (we could add another colors if the community is represented my multi-polar parties instead of being a bipolar community), which will represent the two main poles of the current political environment (For example, liberals and conservatives, those set of poles could change from community to other and from time to time). The same badge or color would be given to each article. There will also be profiles for news sources (newspapers, blogs, TV shows … etc) that will indicate their political leaning. This coloring metric will be used to filter news feed according to the user profile/color). They will also be displayed beside each news article and news source.

The experiment will start with few phases (left to be crafted by the experiment designer) and after each phase a survey will be provided to users in order to measure how each phase affected their perspective of the opposite pole and their own pole. Each phase will build a news feed filter based on different tactics (will be left to the experiment designer to define the level of exposure, the content being displayed, the number of phases … etc). Gradually the filters will be modified to pass more news that promotes or expose the other pole opinions.

The first phase’s filter will filter out news that are most likely to be controversial to the user, and will pass mainly mainstream news and news that match their preferences.

The second phase filter will be changed to include some news from the other pole but are not controversial or triggering the user to accept or reject to read the article. Suppose that the most competing poles are poles A and B, and the user politically belong to pole A. The aggregator filter will pass those news that will contain humanitarian works done by group B public figures, That would emotionally (the Like dimension) affect the people in group A, I would expose them to more commons between those groups than expose them to the most controversial topics. After some period of exposure we would do how that affected their perception of the other pole(s).

In the next few phases we would expose (increase the amount displayed in their news feed) users to more news that discusses the other pole opinions. Then perform the similar surveys to measure their movement from one pole to another.

Read More

Reflection #8 – [09/25] – [Eslam Hussein]

1. Garrett, R. K., “Echo chambers online?: Politically motivated selective exposure among Internet news users”, (2009)

2. Resnick, Paul, “Bursting Your (Filter) Bubble: Strategies for Promoting Diverse Exposure”, (2013)

Summary:

The first paper is about the selective exposure of online news, whether a user’s consumption of online news based on his political background or not. The author conducted an experiment on 727 online users from two news websites (AlterNet and WorldNetDaily) with different political leaning (left and right respectively). The author tracked their usage and browsing behavior. Each user was given a set news articles about different political controversial topics. The results of this study suggest that opinion-reinforcing storied gets more exposure while opinion-challenging articles get less exposure. He also found that users do not avoid opinion-challenging news and spend some time reading them.

The second paper mentions different strategies developed to diminish selective exposure and promote diverse exposure of information among online users.

Reflection:

– I would prefer if the author of the first paper conducted a longitudinal study and later asked those users how the exposure to opposite point-of-view would challenge their beliefs and how far it might change it.

– I would like also to design a method that presents the counter-attitudinal opinion/news in an acceptable way for the users without triggering their beliefs’ self-defense and reject the information from the opposite side. May be this could be achieved by merging different strategies mentioned in the second paper.

Those papers inspire me to build a database of profiles of news media (broadcast and online). I would collect data such as their political leaning, their stance towards popular and controversial topics, their credibility. I would also record their connectivity to each other and to real world entities (such as countries, governments, parties, businessmen … etc). I would also give each of them different metrics representing how much they broadcast misinformation (rumors and fake news). I believe such dataset would be very beneficial.

– I would like to measure how far the selective exposure of news articles on online news website different from the news that appear in the news feed of Facebook and twitter. I mean would the personalization of news feed on Facebook and twitter be similar to our selection on online news websites.

– I want also to study if people of similar political backgrounds are clustered together on Facebook and twitter (I mean from the network analysis view). Does me and my online friends (on Facebook) share similar beliefs and political preferences and how often we appear in each others news feed (our posts and comments).

In my opinion the reading time metric is irrelevant and misleading. Since the reading time of each article depends on different factors such as the article length (longer articles need longer time to read), the vocabulary and language difficulty (which might the user reading speed) and also the education levels of the users (which will clearly affect their reading speed and information digestion).

Read More

Reflection #6 – [09/13] – [Eslam Hussein]

  1. Christian Sandvig, Kevin Hamilton, Karrie Karahalios, and Cedric Langbort, “Auditing Algorithms: Research Methods for Detecting Discrimination on Internet Platforms
  2. Anikó Hannák, Piotr Sapiezynski, Arash Molavi Kakhki, David Lazer, Alan Mislove, and Christo Wilson, “Measuring Personalization of Web Search


Summary:

Both papers are almost about the same topic Algorithmic Audits. In the first paper, the authors discuss different research methods used in auditing algorithms on the internet in order to detect misbehaviors such as discrimination and misinformation. They gave a brief history of the term Audit Study, then mentioned five different auditing methods:

  • Code Audits
  • Noninvasive User Audit
  • Scraping Audit
  • Sock Puppet Audit
  • Crowdsourced Audit / Collaborative Audit

And they described different examples of each method and some of their drawbacks and limitations.


In the second paper, the authors used 2 of the auditing methods described in the first paper in order to measure personalization in web search engines, specifically Google Web Search, Microsoft Bing and DuckDuckGo. Those methods are:

  • Sock Puppet Audit, by creating artificial accounts on each platform and manually crafting them. They used those account as control accounts in experimenting different features that might affect the search engine under investigation.
  • Crowdsourced Audit, by using the services provided by the Amazon mechanical Turks. They employed 300 workers in order to simulate different real time users of those platforms.

They discovered that there is about an average of 11.7% variation on Google and 15.8% on Bing. Those differences of search results are due to different parameters such as user’s accounts features, IP addresses, search history, cookies … etc.


Reflection:

  • Although lots of researchers do a very good job in designing their experiments and surveys using crowdsourcing platforms such as Amazon Mechanical Turks, finding a true representative sample using those platforms is still questionable. What if the study requires samples from different socioeconomic statuses or different educational levels? We cannot find people from different financial status on such platforms, and that is due to its low paid income which will attract mostly low income workers (about 52% of workers gain less than $5 per hour).
  • Another raised issues, is auditing special category of algorithms that depends heavily on machine learning models. Those algorithms may misbehave and produce harmful results such as misinformation and discrimination. Who might be hold accountable for those algorithms? Is it the machine learning engineer, the decision makers or the algorithm itself?
  • Personalization on web search engines could result in a filter-bubble effect which might lead to discrimination of information quality provided to users based on their location, language or preferences. Some might receive correct legit information and others may get flooded by rumors and misinformation. How could we prevent such behavior? I guess we first need to detect those features that greatly affect the results returned by those systems. Then we could find a mechanism to help the user reach more correct information. We might provide the user with results for the same search query without any filtration or personalization after running the same query in a sandbox environment.
  • From another point of view, we could consider personalization produces better results for the user not a source of information discrimination. How could we set apart which is which? Discrimination and misinformation or a better user experiment? I guess the best who can judge are the users themselves, offering them both results before and after personalization and they decide which is better. I guess this would be an interesting study.


Read More

Reflection #5 – [09/11] – [Eslam Hussein]

  1. “I always assumed that I wasn’t really that close to [her]: Reasoning about Invisible Algorithms in News Feeds.”
  2. “Exposure to ideologically diverse news and opinion on Facebook.”


Summary:

The first paper follows a very deep qualitative approach studying the awareness of Facebook users towards the algorithms that curates their news feed. And how people react when they know that their news feed is not random or inclusive. They developed a system – FeedVis – that shows users stories from their families News feed and allows users to control their own news feed. They try to answer three questions:

  • How aware are the users about their news feed curation algorithm?
    • 5 % were unaware of such algorithm
    • 5% were aware due to different reasons (inductive and deductive)
  • What is their reaction when they know about it? Do they prefer the old curated algorithm or the output generated by FeedVis?
  • How did the participation of this study affect their usage of Facebook?


The second paper studies data from more than 10 million Facebook users to study what factors affect the nature and ideology of news we receive in our news feed on Facebook. They defined three features that would affect our news feed: 1- User interaction (e.g. clicks) with the shown news, 2- friends’ network shared news and its diversity, and 3- algorithmically ranked news by Facebook news curation algorithm.

They found that what shapes our news feed is what we select to choose and interact with. That might trap us into echo-champers.


Reflection:

  • It is amazing how such algorithms could alter people’s feeling and ideas. Some participants lack self-confidence just because nobody reacted to their posts. Awareness of such algorithms increased their postings and interaction with Facebook knowing that nobody react to their posts was due to the curation algorithm
  • The authors might do further analysis about the similarities and differences, the backgrounds and beliefs of each participant and their friends who got their stories appear in the news feed. This analysis might help answer a few questions about the news feed curation algorithms of Facebook:
    • Does Facebook really connects people? Or creates more closed communities of common interests and backgrounds?
    • How much those algorithms contribute into increasing polarization? And the possibility to design new tools to alleviate it?
  • The second paper answered many of the questions raised from the first one, it highlights the reasons and factors that influence the algorithm in the first paper, which is our own choices and interaction with what is displayed in our news feed. We are the ones who – indirectly – direct our news ranking algorithm, I believe our news feed is just a reflection of our ideology and interests.
  • I think the Facebook news feed curation algorithm should be altered in order to alleviate the polarization of its users, creating more diverse interactive healthier environment instead of being trapped in closed-minded separated communities (or echo chambers as the authors call)


Read More

Reflection #4 – [09/06] – [Eslam Hussein]

Srijan Kumar, Justin Cheng, Jure Leskovec, V.S. Subrahmanian, “An Army of Me: Sockpuppets in Online Discussion Communities


Summary:

The authors in this work tries to automatically detect sockpuppets, which they define as “a user account that is controlled by an individual (or puppetmaster) who controls at least one other user account”. They study data from 9 different online discussion communities. In this paper they addressed the features of sockpuppets from different perspectives:

– Linguistic traits: what language they tend to use

– Activities and Interactions: how sockpuppets communicate and behave with each other and with their communities, and how their communities react to their activities.

– Reply network structure: study the interaction networks of sockpuppets from a social network analysis perspective

They also identified different types of sockpuppets based on two different criteria:

  1. Deceptiveness: Pretenders and non-pretenders
  2. Supportiveness: Supporter and non-supporter

They also built a predictive model to:

  1.  Differentiate pairs of sockpuppets from pairs of ordinary users
  2. Predict whether an individual user account is a sockpuppet or ordinary one


Reflection:

The authors did pretty comprehensive work to approach the problem of detecting sockpuppets and classifying accounts into ordinary or sockpuppet accounts

But I have a few comments/suggestions on their work:

  • I wondered why the discovered sockpuppets almost appeared in groups of two accounts, but I believe that is because the authors set a very restrictive constraints when identifying sockpuppets, such as: 1) – they must made their communication from the same IP address or 2) – set a very small time window of 15 minutes between their interactions in order to identify them as sockpuppets played by the same puppetmaster. I would suggest that the authors:
    • Remove or relieve the IP address constraint in order to catch more sockpuppets that belong into the same group, since a more realistic scenario would suggest that a puppetmaster would control more than two accounts (no body forms an online campaign of only two accounts)
    • Increase the time window, since the puppetmaster would need more time to synchronize the interactions between those sockpuppets
  • This model needs to be modified in order to generalize it to more online discussion communities such as facebook and twitter, it is tailored/over fitted more to the Disqus communities. Other features from those much larger and more interactive platforms would definitely improve this model and enrich it
  • As always I have observation taken during and after the Arab Spring, since social media platforms were used often as battle fields between opponent parties and the old regimes:
    • They have been used to promote or support figures or parties during the different stages of the Egyptian elections.
    • They were used to demoralize the opponents or resistance
    • Used to spread rumors and amplify their effects and permanence by just repeating/spreading those using sockpuppets. Psychologically, when we repeat a lie over and over it stabilizes in people memory as a fact and vice versa (Illusory truth effect)
    • People started to recognize sockpuppets and their patterns and called them some Arabic name to identify them “لجنه”. There is a very common and known term called on a group of sockpuppets who have the same objective and controlled by the same puppetmaster evolved during the Arabic spring called “لجنه الكترونيه” or electronic battalion/committee in English.
  • The authors approached the problem as a classification problem of ordinary or sockpuppet accounts. I would suggest also to address it as a clustering problem not only as a classification one. That could be achieved by encoding several features (linguistic traits, activities and interactions, ego-networks) into one objective function. Which would be used to represent the similarity of the discovered communities of sockpuppets. The more optimal this function the more similar those discovered sockpuppets communities.


Read More

Reflection #3 – [9/04] – Eslam Hussein

Tanushree Mitra, Graham P. Wright and Eric Gilbert “A Parsimonious Language Model of Social Media Credibility Across Disparate Events”

Summary:

The authors in this paper did a great work trying to measure the credibility of a tweet/message based on its linguistic features and they also incorporated some non-linguistic ones. They built a credibility classifier statistical model that depends on 15 linguistic features which could be classified into two main categories:

1- Lexicon based: that depends lexicons built for special tasks (negation, subjectivity …)

2- Non-lexicon based: questions, quotations … etc.

They also included some control features used to measure the popularity of the content such as number of retweets, tweet length … etc.

They used a credibility annotated dataset CREDBANK to build and test their model. And they also used several lexicons to measure the features of each tweet. Their model achieved a 67.8% accuracy which conclude that the language usage has considerable effect on assessing the credibility of a message.


Reflection:

1- I like how the authors addressed the credibility of information on social media from a linguistic perspective. They neglected the source credibility factor when assessing the credibility of the information due to studies that show that information receivers pay more attention to its contents than its source. In my opinion the credibility of the source is a very important feature that should have been integrated to their model. Most of people tend to believe information delivered by credible sources and question ones that come from unknown sources.

2- I would like to see the results after training a deep learning model with this data and those features.

3- Although this study is very important step in countering misinformation and rumors in social media. I wonder how people/groups who used to spread misinformation would misuse those findings and linguistically engineer their false messages in order to deceive such models. What other features could be added in order to prevent them from using the language features to deceive their audience?

4- This work inspires me to study the linguistic features of rumors that have been spread during the Arab spring.

5- I find the following findings very interesting and deserves further study. “The authors found that the number of retweets was one of the top predictors of low perceived credibility. Which means the higher number of retweets the less credible the tweet, and also retweets and replies with longer message lengths were associated with higher credibility scores”. That finding reminds me of online misinformation and rumor attacks during the political conflict between Qatar and its neighboring countries, where online paid campaigns organized to spread misinformation through twitter characterized by the huge number of retweets without any further replies or comments, just retweets. How numbers could be misleading.

Read More