Visualization of volume data is critical in a variety of application domains, such as medicine, geophysical exploration, and biomechanics. For effective analysis of a 3D volume, scientists and other users need to integrate various views and to peer inside the volume. However, despite many advances in volume rendering algorithms, neither traditional displays nor traditional interaction techniques are sufficient for efficient and accurate analysis of complex volume datasets.
We are studying the use of displays with higher levels of fidelity, as well as natural and innovative 3D interaction techniques, to allow scientists to view and analyze volume datasets easily without prior segmentation. Based on our findings, we plan to design, prototype, and evaluate a next-generation interactive volume data analysis system with best-practice display characteristics and interaction techniques.
Support for this project is provided by the National Science Foundation under a collaborative award between Virginia Tech and Brown University (NSF award numbers 1320046 and 1319606).
Display Fidelity Studies
Our prior studies showed benefits of immersive displays with high fidelity in the visual analysis of volume data. Those studies are described in the project Immersive Volume Data Visualization and the associated publications at IEEE VR 2012 and IEEE VR 2013. In this project our goal is to understand how the different components of display fidelity affect the analysis of volume datasets. In the experiments we usedatasets generated from synchrotron microscopic computed tomography (micro-CT) scans of beetles. The tasks were based on general tasks from the biomechanical domain, classified by our proposed taxonomy (see below). The study was divided into two phases.
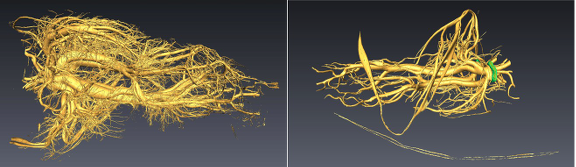
Isosurfaces of the datasets used in the study. Left: Pterostichus, Right: Platynus genus
Phase I In the first phase we focused on the effect of Field of Regard (FOR), Stereoscopy (ST), and Head Tracking (HT) on task performance. The goalwas to gather evidence to support or reject the following hyphothesis. Hypothesis 1 – Levels of FOR, Stereo and HT affect performance in different ways across task categories.Hypothesis 2 – Combinations with higher fidelity levels would benefit task performance We completed a major experiment (72 participants) evaluating the effects of VR system fidelity on the analysis of isosurface-rendered volume datasets. We visualized the isosurfaces in a CAVE-like display. We ran a controlled experiment evaluating the effects of three components of system fidelity (field of regard, stereoscopy, and head tracking) on a variety of abstract task categories that are applicable to various scientific domains, and also compared our results with those from previous studies. We report many significant findings.
Findings:
- Higher levels of system fidelity improved task performance
- Stereo had the strongest effects on search and spatial judgment
- FOR improved performance in 2 spatial judgment tasks
- HT improved confidence in a search task
- Compared significant findings with those from VR-STUDY-I
- Effects of system fidelity may depend on volume rendering technique
For example, for search and spatial judgment tasks with isosurface visualization, a stereoscopic display provides better performance, but for tasks with 3D texture based rendering, displays with higher field of regard were more effective, independent of the levels of the other display components. We also found that systems with high field of regard and head tracking improve performance in spatial judgment tasks. Our results extend existing knowledge and produce new guidelines for designing VR systems to improve the effectiveness of volume data analysis.
Phase II
Our former experiment (phase one) evaluated the effect of different virtual reality display characteristics on tasks involving isosurface datasets. In the Phase-II we looked more closely into the effect of FOR and ST across different display platforms. For that we performed a multi-site VR fidelity component experiment with 60 participants in collaboration with Brown University. We used the phase one experimental design and the task taxonomy introduced in our 2015 Vis publication. Virginia Tech conducted the experiment in a 4 wall CAVE and in a HMD, while Brown performed the same experiment in another similar CAVE.
Our results confirm the high-level results of our previous study. Higher fidelity settings for both, field of regard and head tracking significantly improve the performance of users in complex spatial data exploration tasks. However, we found differences in individual task performances between platforms. Additionally they informed us about the platform dependent differences that warrant further experiments. A publication summarizing our finding is currently in preparation.
We have continued the analysis of data generated by phase two of our experimental evaluation of virtual reality display characteristics in spatial data analysis tasks. In addition to the previously reported findings on the beneficial effects of a high field of regard and stereo view on task performance, we found some evidence that participants’ interaction strategy (i.e., whether they viewed the datasets by walking around them or manipulating them with a handheld input device) affected their task performance.
Current recommendations
The display fidelity study has already provided some insights on how to improve task performance for volume data analysis on immersive VR systems.
- For analysis of isosurface rendering, stereoscopic displays can be very effective (particularly for search and spatial judgment tasks), while for analysis of volume visualization based on 3D texture, systems with high FOR are more effective, independent of the fidelity of other components of the VR system.
- When analyzing isosurface rendering, higher levels of fidelity based on FOR, ST and HT can improve analysis speed in a variety of tasks.
- We recommend VR systems with both FOR and HT at higher levels for tasks that require spatial judgment in volumes.
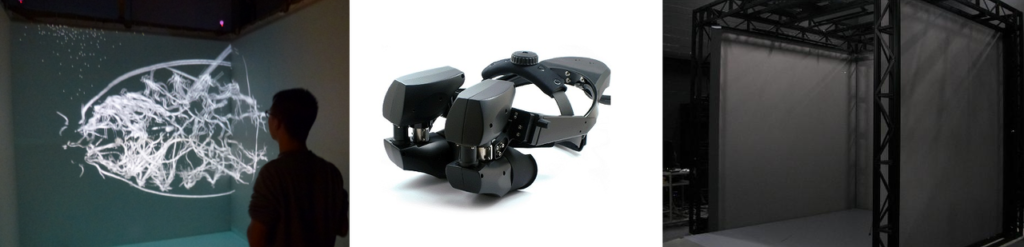
Left: The CAVE at Brown University. Center: Nvis SX111 HMD. Right: Virginia Tech Visionarium Viscube.

High Fidelity Immersive Visualization
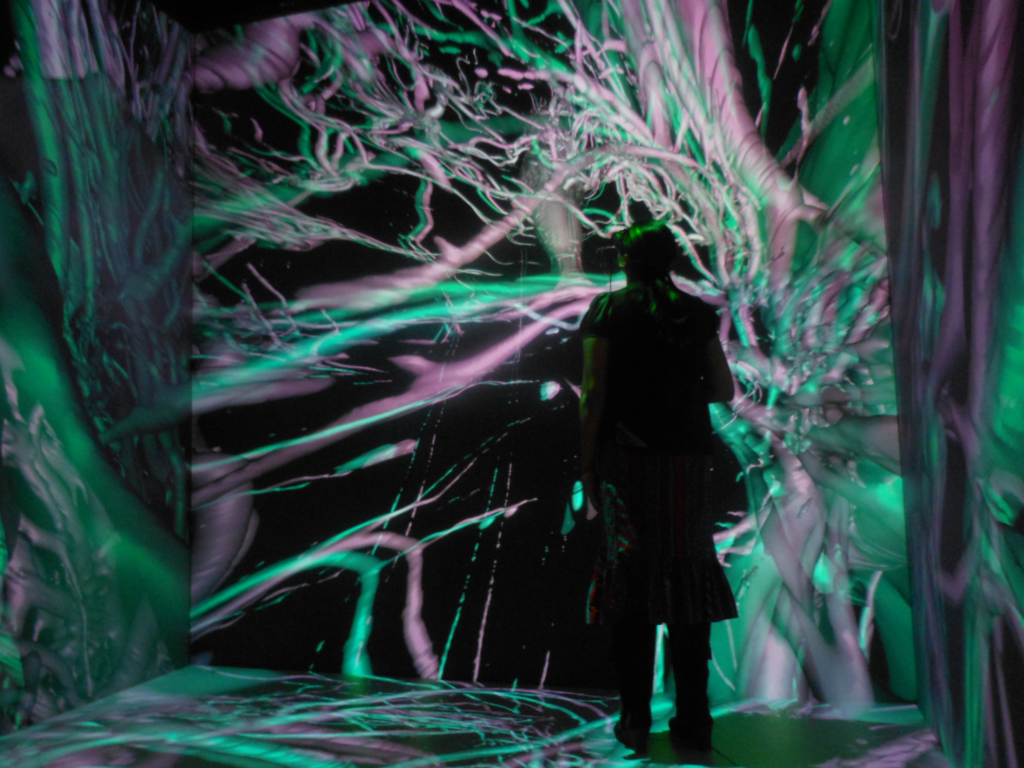
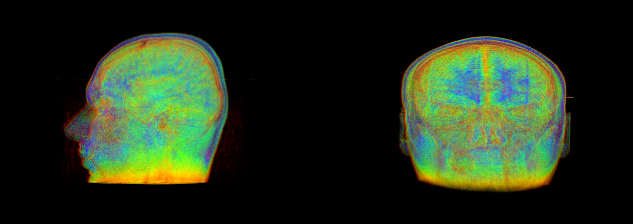
The YURT is a high fidelity VR display room at Brown University that uses 69 full HD projectors and 145 mirrors to create a 360 degree curved surface with pixels smaller than the human retina can perceive. As part of this project we performed several iterations of calibration procedures to allow the use of its unique display capabilities in upcoming studies. As first experiment in the YURT environment we have performed a case study evaluating the potential for interactively identifying placental blood vessels using MRI in large-scale virtual reality environment. This collaboration with the Rhode Island Hospital (RIH) aims to improve the planning stage of twin-to-twin transfusion syndrome intervention surgery, a potentially fatal vascular condition in twin pregnancies. Treatment of the condition involves endoscopically severing connected placental blood vessels and current clinical practice does not include a planning stage to locate these vessels.
Our results show that medical professionals are able to identify relevant vessels within our immersive visualization system and effectively utilize the larger range of motion allowed in virtual reality, in contrast to the limited views provided by traditional endoscopes. Our medical professional collaborator and participants believe that by providing surgeons with a way to find these vessel connections before beginning surgery, we might enable them to improve the outcomes. The outcome of our experiment can therefore be seen as proof of concept for a new application area of immersive VR environments. The main contributions are a demonstration of value of the large VR environment for a medical task, and a quantification of the feature size that medical professionals can identify using volume rendered MRI data.
We have also developed a VR application to visualize the substrate dynamics involved in creating dinosaur footprints. This ongoing project is a collaboration with researchers of the evolutionary biology department at Brown University. The application currently supports subsampling of DEM simulation datasets as a volume or as multiple horizontal slabs of particles. Various visualizations methods including particle clouds, streamlines and surface interpolations allow for extensive data exploration of the interaction between foot and substrate. We are currently developing novel 3D interaction techniques and clustering methods to assist domain scientists in the analysis of their spatially complex data. A formal evaluation of the effectiveness of the application is planned as soon as work on the visualization methods is completed.

3D Interaction technique design and evaluation
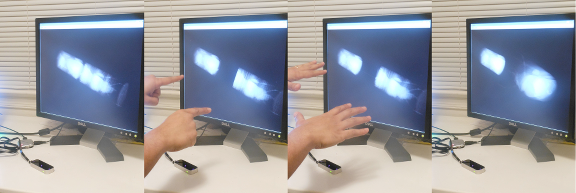
Our prior work on the Volume Cracker – a Bimanual Free-Hand 3D interaction technique to iteratively crack Raw Volumetric Data – inspires our current work. The original Volume Cracker was published at ACM SUI 2013.
The original Volume Cracker design was limited due to cumbersome and expensive hardware and the inability to interact with real volume data. New input devices such as the Leap Motion Controller enable 6-DOF tracking of bare hands and fingers, inspiring us to design a new version of the Volume Cracker addressing its prior limitations. We have iteratively designed and developed a prototype of the Bare-Hand Volume Cracker that works directly on real volume datasets (see video below). A study comparing the bare-hand VC with bare-hand versions of the axis-aligned slicing and arbitrary 3D slicing techniques is complete, and demonstrated the advantages of our technique.
We have also worked on new techniques and applying the Volume Cracker to immersive displays. To be able to evaluate our designs we need to support arbitrary manipulation of the volume dataset at interactive rates. Since immersive rendering can also be quite demanding (low latency and stereo) we are developing a framework to support voxel manipulation and stereo rendering using GPU programming. This will allow the us to combine the findings of these two areas to support the analysis of volume datasets with more immersive metaphors.
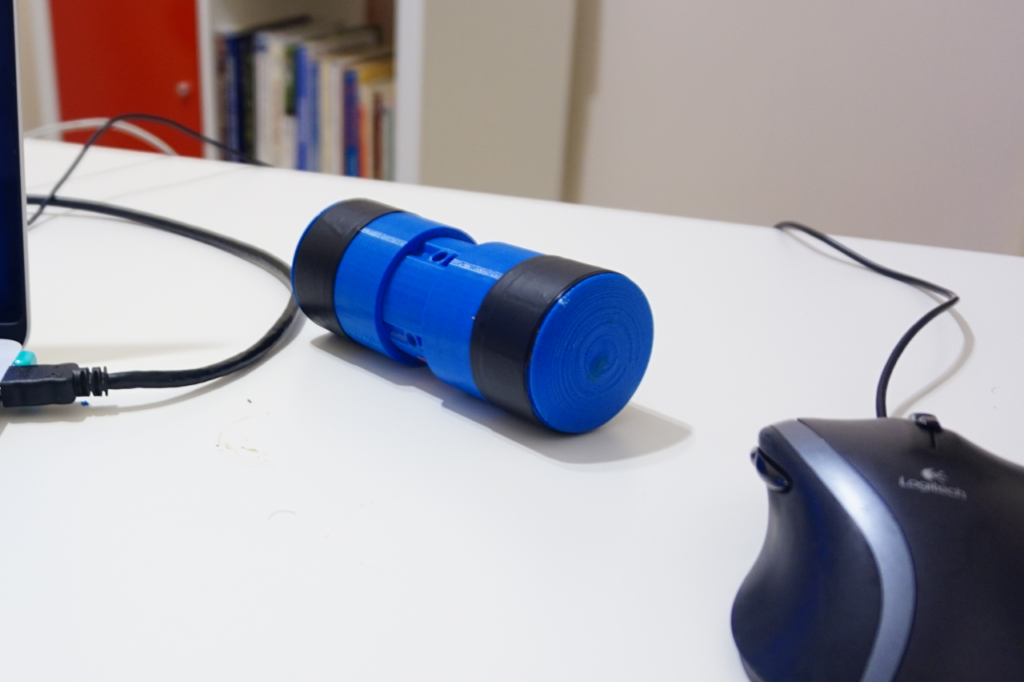
Heading towards our goal of designing a next generation volume analysis system, we have proceeded with the design of 3D interaction techniques for biomedical volume manipulation. In collaboration with domain scientists we have designed Capsule, an inertial input device to improve the scientist’s workflow during the analysis of 3D biological data such as proteins, CT scans or neuron fibers. The hand-held controller provides intuitive interaction methods for 3D orientation, selection and interaction tasks. We have used the first prototype to gather feedback on the design in the domains of molecular biology and biomechanics. We have also investigated the use of the device in collaborative 3D manipulation tasks. This new technique uses Capsule along with a 3D camera to support synchronous and asynchronous collaboration. It was presented at 2016 IEEE 3DUI, in Greenville as an entry to the 3DUI contest. From these findings we intend to produce a second improved prototype and conduct an evaluation within immersive environments.
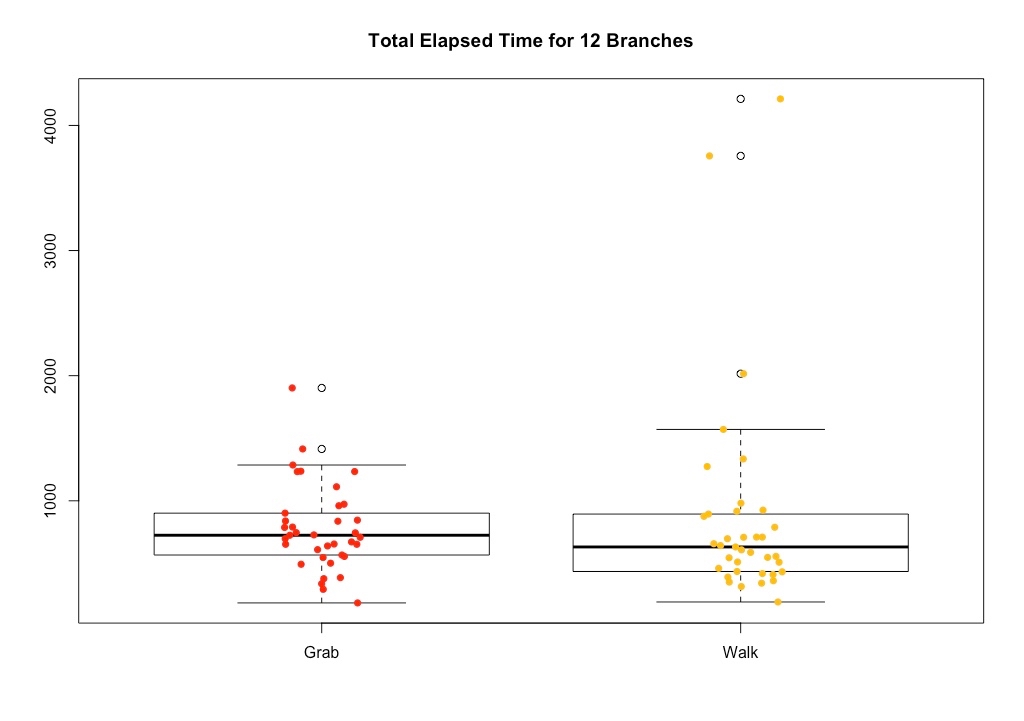
Based on the evidence about walking from our phase 2 display fidelity experiment (see above), we have completed data collection on a new experiment at Virginia Tech that explores this possible effect more directly. In this new experiment, we asked users to perform a difficult branch counting task inspired by one of the biological tasks in our earlier studies. We compare performance on this task (time taken to provide a certain number of correct answers) between two interfaces: one in which the dataset is stationary and the user must walk and move her body to obtain different views of the data, and a second where the user must stand in one location and move the dataset to obtain different views. Preliminary data analysis indicates that the walking interface has some benefits for the most difficult tasks, but this effect may be moderated by the user’s spatial ability.

Task Taxonomy
We have surveyed a broad community of international researchers working with volume data. This survey has revealed a number of interesting findings about the tasks performed in volume data analysis across a wide variety of domains. Based on the results of this survey, we have drafted a proposed task taxonomy for volume data analysis. The taxonomy lists generalized tasks such as search, pattern recognition, spatial understanding, quantitative estimation, and shape description. Some of the tasks also have sub-tasks (e.g., quantitiative estimation tasks can be absolute or relative). The taxonomy also lists supporting tasks (interactions performed during volume data analysis in service of the primary tasks, such as segmentation, navigation, or path following), and dataset properties. The taxonomy makes it possible to generalize the findings of experiments and to transition successful interaction technniques and strategies from one domain to another.
The taxonomy currently classifies volume data analysis tasks as follows:
- Search: We define a search task as one in which the user is searching for a feature in the dataset.
- Searching for presence/non-presence of a particular feature/object in a dataset. e.g., “Search for distinct bone segments in this sample.”
- Counting objects/features, given they are present. e.g., “Count the total number of tracheal tubes and categorize them by diameter.”
- Pattern Recognition: We define a pattern as a characteristic that is repeated or a trend that we see as we look through the dataset.
- Looking for a trend. e.g., “Blood vessels on one side of the dataset are skinny and they get progressively bigger as we go through the dataset. Identify on which side of the dataset we notice this trend.”
- Does a pattern repeat itself in different parts? How many times? e.g., “Looking through the sample longitudinally, count the number of fibers curving through the sample, and the number of straight fibers.”
- Spatial Understanding: These are tasks where the user makes a judgment in a 3D spatial context about the position and/or orientation of a feature on an absolute or relative sense. e.g., “Which sets of tubes are located closest to the front of the dataset?”
- Absolute – Locating a feature/object which is the highest, lowest, farthest, or closest to/from a viewpoint, or in the overall dataset. e.g., “Which sets of tubes are located closest to the front of the dataset?”
- Relative – Judging whether a feature/object ‘A’ is higher/lower/farther/closer than another feature/object ‘B’. e.g., “Which of the twisting fibers is the closest to the center of the bundle?”
- Judging whether two features/objects intersect or if they are distinct. e.g., “Does the left side of the tracheal system connect to the right side, throughout the body?”
- Quantitative Estimation: These include tasks in which the user has to estimate some property of the dataset, or part of it, quantitatively. Examples of things we can estimate in a volume dataset are density, size, volume, distance, length, surface-area, curvature, angle, velocity and other super-scalar quantities, etc.
- Absolute estimation. e.g., “What is the density of the highlighted region of the bone marrow?”
- Relative estimation (binary). e.g., “Study the thickness of the borders and the joints between the cells. Are different joints and borders of comparable or variable thickness?”
- Relative estimation (quantitative). e.g., “How many times denser is the boundary of the cells at the center than the outer boundary of the cluster?”
- Shape Description: These include tasks where the user describes the shape of either the whole or some part of the dataset qualitatively. e.g., “What is the cross-sectional shape of each tracheal tube?”
Journal Articles
Move the Object or Move Myself? Walking vs. Manipulation for the Examination of 3D Scientific Data Journal Article
In: Frontiers in ICT, vol. 5, 2018.
Bare-Hand Volume Cracker for Raw Volume Data Analysis Journal Article
In: Frontiers in Robotics and AI, vol. 3235512181919252119299, 2016.
Effects of VR System Fidelity on Analyzing Isosurface Visualization of Volume Datasets Journal Article
In: IEEE Transactions on Visualization and Computer Graphics, vol. 20, pp. 513-522, 2014.
Conferences
Designing capsule, an input device to support the manipulation of biological datasets Conference
2016 IEEE Symposium on 3D User Interfaces (3DUI)2016 IEEE Symposium on 3D User Interfaces (3DUI), IEEE IEEE, Greenville, SC, USA, 2016.
2016 IEEE Virtual Reality (VR)2016 IEEE Virtual Reality (VR), IEEE IEEE, Greenville, SC, USA, 2016.
Ray, camera, action! A technique for collaborative 3D manipulation Conference
2016 IEEE Symposium on 3D User Interfaces (3DUI)2016 IEEE Symposium on 3D User Interfaces (3DUI), IEEE IEEE, Greenville, SC, USA, 2016.
A classification of user tasks in visual analysis of volume data Conference
2015 IEEE Scientific Visualization Conference (SciVis)2015 IEEE Scientific Visualization Conference (SciVis), IEEE IEEE, Chicago, IL, USA, 2015.
Interactive Coarse Segmentation and Analysis of Volume Data with a Suite of 3D Interaction Tools Conference
IEEE VR Workshop on Immersive Volume Interaction (WIVI), Orlando, FL, 2013.
Proceedings
Sponsor